
Höheres ApoB, länger, schlimmer
Kumulativ Apolipoprotein B-Belichtung
Biologische Rationale, Evidenz beim Menschen, Messherausforderungen und ein vorgeschlagener Forschungsrahmen
Zusammenfassung
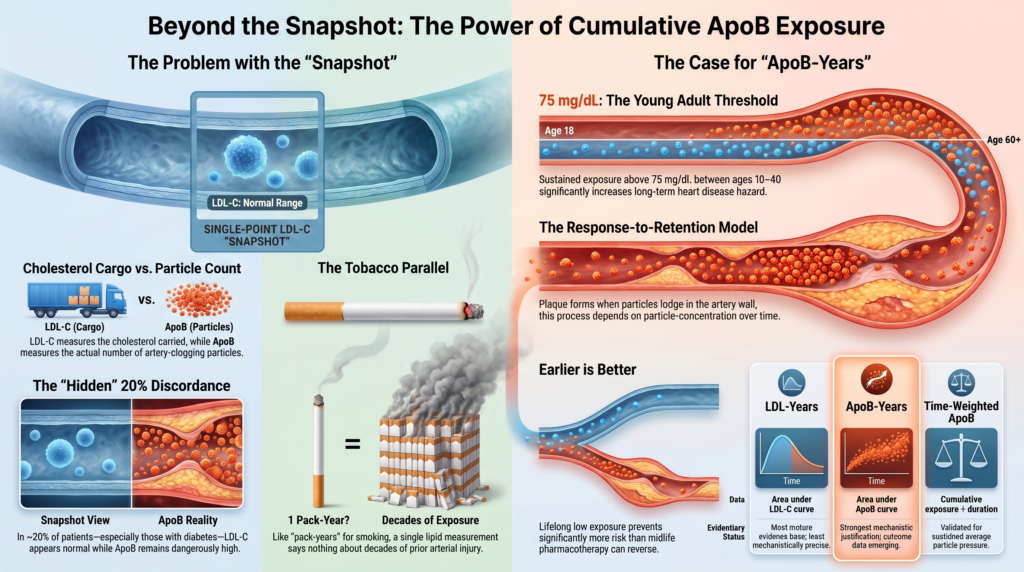
atherosklerotisch Herz-Kreislauf-Erkrankung (ASCVD) ist eine Erkrankung der kumulative Exposition, obwohl sie dennoch fast ausschließlich durch querschnittliche Lipidmessungen bewertet wird. Ein wesentlicher kausaler Bestimmungsfaktor von Plaque ist die Anzahl der Apolipoprotein-B-ApoB)-haltig Lipoprotein Teilchen, die das Endothel und im Arterienblut zurückgehalten Intima, über die Zeit integriert. Dieses Konstrukt — apoB-Jahre — ist mechanistisch treuer als jeder einzelne ApoB-Wert und treuer als LDL-Cholesterin (LDL-C) zu jedem beliebigen Zeitpunkt, da LDL-C misst Cholesterin Fracht statt Partikelanzahl.
Diese Übersichtsarbeit fasst vier konvergierende Linien menschlicher Evidenz zusammen: (1) longitudinale Kohortendaten, die zeigen, dass die kumulative LDL-C- und kumulative ApoB-Exposition das Auftreten von ASCVD unabhängig von gleichzeitigen Lipidwerten vorhersagen; (2) Unstimmigkeit Analysen, die zeigen, dass bei einer Diskrepanz zwischen ApoB und LDL-C das Risiko näher mit ApoB korreliert, wobei die Prävalenz und das Ausmaß dieser Diskrepanz stark von der Population, dem Lipidphänotyp, dem Behandlungsstatus und der Methode zur LDL-C-Bestimmung abhängen; (3) Bildgebungs- und Pathologiedaten, die die kumulative Exposition mit Plaquebelastung während zwischen Plaque-Last und Ereignisrisiko unterschieden wird; und (4) Interventionsdaten, die zeigen, dass eine intensive Senkung atherogener Lipoproteine, die hauptsächlich durch LDL-C-senkende Interventionen nachgewiesen wurde, die Koronargefäße aufhält und teilweise zurückbildet Atherom entlang eines Dosis-Wirkungs-Beziehung Kurve, bei der im untersuchten Bereich kein klarer unterer Schwellenwert ermittelt wurde.
Auf dieser Grundlage definieren wir die kumulative apoB-Exposition als deskriptives Forschungsmass, ausgedrückt in mg/dL·Jahren, und legen explizit dar, warum sie derzeit nicht in eine individuelle Risikoschätzung umgerechnet werden kann. Drei Einschränkungen sind entscheidend und werden nacheinander untersucht: die veröffentlichte kumulative Exposition Hazard Ratios wurden aus Spline-basierten gemischten Modellen über ein definiertes Altersfenster abgeleitet und beschreiben einen kohortenbezogenen Zusammenhang, keinen individuellen Multiplikator; eine apoB-Steigung im Populationsmittel kann den Verlauf der frühen Lebensphase eines Einzelnen nicht rekonstruieren; und studienspezifische Zusammenhänge zwischen Plaqueveränderung und Ereignisreduktion können nicht auf einzelne Patienten übertragen werden. Wir behandeln apoB-Jahre entsprechend – als eine Messgröße im Kandidatenstatus, die Ableitung, Kalibrierung und externe Validierung erfordert –, und schließen mit dem Validierungsprogramm, das erforderlich wäre, bevor sie in die Versorgung einfließen könnte.
1. Das Problem mit dem Schnappschuss
Das moderne Lipidmanagement fordert von chronisch Kranken Arterie Eine einzige Frage in einem einzigen Augenblick. Einem 52-jährigen Patienten mit einem LDL-C-Wert von 118 mg/dL werden auf der Grundlage eines Messwerts, der den heutigen Zustand beschreibt, eine Risikokategorie, ein Behandlungsschwellenwert und ein Nachbeobachtungsintervall zugewiesen. Dies sagt nichts darüber aus, ob diese Person dreißig Jahre lang einen LDL-C-Wert von 75 mg/dL hatte und in den letzten drei Jahren angestiegen ist, oder ob sie seit der Adoleszenz 160 mg/dL hatte und der Wert gerade erst zu sinken begonnen hat. Diese beiden Arterien befinden sich nicht im selben Zustand, und keine noch so große statistische Anpassung des aktuellen Wertes gleicht diesen Unterschied aus.
Die Parallele zur Tabakexposition ist konzeptionell nützlich, wenn auch biologisch unvollkommen: Packungsjahre selbst ein unvollkommener Index ist, der die Inhalationstiefe, den Zeitpunkt des Aufhörens oder nichtlineare Effekte nicht erfasst, und die apoB-Exposition interagiert gleichermaßen mit der arteriellen Anfälligkeit und anderen Risikofaktoren. Dennoch ist die Logik übertragbar. Eine einzelne Messung der heute gerauchten Zigaretten ist nahezu uninformativ; Packungsjahre sind die Variable, die prognostische Bedeutung hat. Kumulierte Lipoproteinexposition – “Cholesterinjahre,” “LDL-Jahre,” oder, mechanistischer ausgedrückt, direkter dargestellt als “apoB-Jahre” – ist das kardiovaskuläre Äquivalent [1], [2], [3].
Drei Entwicklungen machen diesen Zeitpunkt zum richtigen, um die Metrik zu formalisieren. Erstens liegen nun direkte longitudinale Daten zur kumulativen ApoB-Exposition vor, nicht nur zur kumulativen LDL-C-[3]. Zweitens sind ApoB-Tests standardisiert, erfordern keine Nüchternheit und sind in vielen Gesundheitssystemen in der Regel kostengünstig, und die Multisozietäre ACC/AHA-Leitlinie zur Dyslipidämie 2026 erweitert die selektive ApoB-Messung und integriert sie stärker in die Routineuntersuchung, wobei auf der bereits in der Leitlinie von 2018 anerkannten, enger gefassten Rolle als Risikofaktor aufgebaut wird, in der ein ApoB-Wert von 130 mg/dL oder mehr als risikosteigernder Faktor bezeichnet wurde, und Triglyceride bei oder über 200 mg/dL eine relative Indikation für die Messung [4], [5], [6Drittens ist die Population, bei der LDL-C in die Irre führt — der insulinresistente und diabetische Phänotyp mit cholesterinarmen Partikeln und triglyceridenreichen Remnants — in heutigen Primärpräventionspopulationen häufig und nimmt zu.
2. Warum Partikel-Zeit und nicht Cholesterin-Jetzt die bevorzugte Expositionsvariable ist
2.1 Antwort-zu-Retention als ein Massenwirkungs-Prozess
Atherogenese beginnt, wenn apoB-haltige Lipoproteine die endotheliale Schranke überwinden und durch ionische Wechselwirkung zwischen den basischen Restclustern auf der subendothelialen Matrix zurückgehalten werden apoB-100 und das negativ geladene sulfatierte Glykosaminoglykan Ketten von intimalen Proteoglykanen Versican, Biglykan, Decorin [7], [8]. Die Bindung geht voraus Entzündung. Es geht der Monozytenrekrutierung voraus., Schaumzelle Entstehung und jedes darauf folgende zelluläre Ereignis. Dies ist das Response-to-Retention-Hypothese, was innerhalb weniger Jahre nach seiner Formulierung bekräftigt wurde [9] und bleibt die dominante mechanistische Erklärung der frühen Atherogenese in zeitgenössischen Übersichtsartikeln [10].
Die kinetische Konsequenz ist der klinisch entscheidende Punkt. Wenn die Plaque-Masse von der Anzahl der retinierten Partikel abhängt und die Retention von der Anzahl der Partikel, die dem Endothel pro Zeiteinheit dargeboten werden, dann verhält sich die Plaque-Akkumulation wie ein Integral und nicht wie eine Momentaufnahme. Transzytose von ApoB-Partikeln ist Rezeptor-vermittelt — Scavenger-Rezeptor Klasse B Mitglied 1 (SR-B1) und der Activin-Rezeptor-ähnlichen Kinase 1 (ALK1) in Verbindung gebracht wurden – und zwar konzentrationsabhängig [10].
Die Stärke dieser Abhängigkeit sollte nicht übertönen werden. Sie ist richtungsweisend konzentrationsabhängig, kein exaktes Eins-zu-Eins-Gesetz beim Menschen. HerzkranzgefäßeDer Eintritt und Verbleib werden durch endotheliale Permeabilität, arterielle Segmentgeometrie und Hämodynamik, Partikelgröße und -zusammensetzung modifiziert, Proteoglycan-Bindung Affinität, Blutdruck, des glykämischen Zustands, der Clearance aus der Intima und der bestehenden Plaque-Architektur. Die vertretbare Aussage ist, dass eine höhere zirkulierende apoB-Konzentration die Anzahl der für den arterielle Einstieg und Retention verfügbaren Partikel erhöht und dass dies, über die Zeit integriert, die kumulative retenzierte Last erhöht, wobei die individuelle Beziehung durch die Anfälligkeit der Arterienwand modifiziert wird.
2.2 Warum ApoB die atherogene Partikelbelastung direkter widerspiegelt als LDL-C
Jedes leberstämmige VLDL, IDL, LDL, und ein Lp(a)-Partikel enthält ein Molekül ApoB-100, und herkömmliche Gesamt-ApoB-Assays können zusätzlich erfassen apoB-48 aus dem Darm stammend Restpartikel. Aufgrund dieses nahezu eins-zu-eins-Verhältnisses liefert das ApoB im Plasma einen standardisierten Schätzwert, der proportional zur Gesamtkonzentration von atherogene Partikel. Hier ist es wichtig, präzise zu sein: Routinetests geben ApoB als Massenkonzentration in mg/dL an und nicht als molare Partikelanzahl in nmol/L, und ApoB-48 aus Darmpartikeln, Unterschiede in der molekularen Masse von ApoB sowie die Testkalibrierung führen alle zu einer Abweichung zwischen der gemessenen Masse und der wahren Partikelzahl. ApoB ist ein standardisierter Stellvertreter für Feinstaubbelastung, nicht buchstäblich eine Anzahl. LDL-C hingegen misst das Cholesterin, das in LDL-Partikeln transportiert wird, was eine variable Menge ist: Partikel sind cholesterinarm in Insulinresistenz, Hypertriglyzeridämie und Typ-2 Diabetes, und in anderen Zuständen cholesterinangereichert [11], [12].
Dies führt zu einem systematischen und vorhersehbaren Versagensmodus. Zwei Patienten mit identischem LDL-C können eine wesentlich unterschiedliche Partikelanzahl aufweisen, und derjenige mit mehr Partikeln hat mehr Objekte, die in die Arterienwand eindringen und sich dort festsetzen können. Der Cholesteringehalt der Partikel gibt keinen direkten Aufschluss über die Anzahl der für den Eintritt und die Retention in den Arterien verfügbaren Partikel, obwohl Partikelzusammensetzung und -größe ihr arterielles Verhalten beeinflussen können. Die kumulative ApoB-Exposition weist daher die direkteste mechanistische Entsprechung zur atherogenen Partikelexposition auf; die kumulative LDL-C-Exposition ist ein Näherungswert dafür, der zufällig auf eine längere epidemiologische Historie zurückblicken kann, da LDL-C in den Kohorten, die am längsten liefen, häufiger gemessen wurde.
Diese Asymmetrie – bessere Konstruktion, dünnere direkte Daten – ist der ehrliche Zustand des Fachgebiets und sollte in jedem darauf aufgebauten klinischen Antrag offen dargelegt werden.
2.3 Die Expositionsmetriken, nach Rang geordnet
| Metrik | Definition | Was es einfängt | Beweisstatus |
| Aktuelles ApoB | Konzentration eines einzelnen gemessenen Partikels | Nur die heutige Partikelbelastung | Gut validiert als querschnittlicher Risikomarker; das Risiko folgt im Allgemeinen dem ApoB, wenn ApoB und LDL-C diskordant sind, wobei die inkrementelle Verbesserung gegenüber genau geschätztem LDL-C oder Nicht-HDL-C je nach Population variiert [13] |
| Zeitgewichteter Mittelwert von ApoB | Kumulative Exposition ÷ Dauer | Anhaltender durchschnittlicher Partikeldruck, Normierung der Fluktuation | Kumulative/zeitintegrierte Exposition für LDL-C validiert; direkte apoB-Evidenz zeichnet sich ab [3], [14] |
| LDL-Jahre | Fläche unter der LDL-C-über-Alter-Kurve | Kumulative Cholesterinfracht, die an die Wand abgegeben wird | Die ausgereifteste longitudinale Evidenzbasis; unabhängig vom LDL-C im mittleren Lebensalter1], [14] |
| Nicht-HDL-Jahre | Fläche unter der Kurve des Nicht-HDL-C im Vergleich zum Alter | Gesamtes Cholesterin in apoB-haltigen Partikeln, einschließlich Remnants | Validiert in Studien zu Jugendlichen über die kumulative Exposition gegenüber erhöhtem Nicht-HDL-C [15]; es wurde kein direkter komparativer Vorteil gegenüber LDL-Jahren nachgewiesen |
| ApoB-Jahre | Fläche unter der ApoB-gegen-Alter-Kurve | Integrierte Partikel-Zeit – direkter Indikator für subendotheliales Einschließen | Direktste mechanistische Entsprechung zur Exposition gegenüber atherogenen Partikeln; direkte Daten zu menschlichen Endpunkten tauchen auf [3]. Nicht als klinischer Messwert validiert. |
Tabelle 1. Kumulative Lipoproteinexpositionsmetriken. Die vorgeschlagene Reihung nach mechanistischer Nähe setzt apoB-Jahre an die oberste Stelle, wohingegen LDL-Jahre derzeit über die tiefgehendste longitudinale Validierung verfügt. Jedes klinische Instrument muss bezüglich dieser Umkehrung ehrlich sein.
3. Die humanen Evidenzen für kumulative Exposition
3.1 Kumulative LDL-C-Exposition: Die reife Evidenzbasis
Domanskij und Kollegen analysierten 4.958 CARDIA Teilnehmer, die im Alter von 18 bis 30 Jahren eingeschlossen und nach dem 40. Lebensjahr über einen medianen Zeitraum von 16 Jahren nachbeobachtet wurden. Sowohl die Fläche unter der LDL-C-gegen-Alter-Kurve als auch der zeitliche Verlauf ihrer Kumulation sagten nach Bereinigung um Geschlecht, ethnische Zugehörigkeit und traditionelle Risikofaktoren unabhängig voneinander kardiovaskuläre Ereignisse voraus: Hazard Ratio 1,053 pro 100 mg/dL·Jahre kumulativer Exposition (p < 0,0001) und Hazard Ratio 0,797 pro mg/dL/Jahr Steigung (p = 0,045) [1Der zweite Koeffizient ist der interessantere. Ein negativer Steigungszusammenhang bedeutet, dass dieselbe Gesamtexposition, die später im Leben stattfand, mit einem geringeren späteren Risiko verbunden war als dieselbe Gesamtexposition, die früher stattfand. Die Zeit ist nicht nur ein Multiplikator für die Konzentration; der Zeitpunkt im Leben, zu dem die Exposition stattfindet, modifiziert das Risiko unabhängig davon.
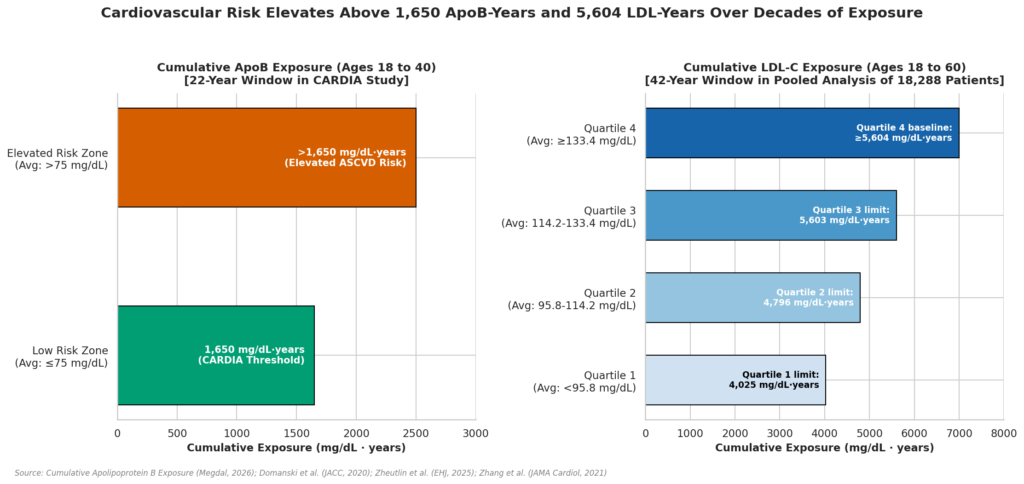
Zhang und Kollegen erweiterten dies in einer gepoolten Analyse von 18.288 Teilnehmern aus vier US-Kohorten und zeigten, dass die kumulative LDL-C-Exposition vom 18. bis zum 60. Lebensjahr das Auftreten von koronare Herzkrankheit unabhängig vom aktuellsten LDL-C-Wert im mittleren Lebensalter, bei kumulativer Exposition Quartile die sich über ca. <4.025, 4.025–4.796, 4.797–5.603 und ≥5.604 mg/dL·Jahre erstrecken [14]. Navar-Boggan und Kollegen zeigten in der Framingham-Offspring-Kohorte dass jedes Jahrzehnt, in dem junge Erwachsene einer Hyperlipidämie ausgesetzt waren, nach Bereinigung um den Nicht-HDL-Cholesterin-Wert im Alter von 55 Jahren mit einer bereinigten Hazard Ratio von 1,39 für eine koronare Herzkrankheit einherging und dass 85% der jungen Erwachsenen mit langanhaltender Hyperlipidämie die Kriterien nicht erfüllt hätten Statin Kriterien im Alter von 40 Jahren gemäß den damals geltenden Richtlinien15].
Diese letzte Abbildung verdeutlicht eine wichtige Einschränkung der gängigen schwellenwertbasierten Ansätze. Eine Metrik der kumulativen Exposition scheint besser geeignet zu sein, Personen zu identifizieren, bei denen sich arterielle Schäden anhäufen, die dennoch unter den herkömmlichen Behandlungsschwellen bleiben – genau die Gruppe, die ein aktueller Einzelschwellenwert strukturell nicht erfassen kann.
| Wie diese Expositionen tatsächlich berechnet wurden – eine Einschränkung für alles Nachfolgende
Domanski und Kollegen haben gemessene Werte nicht aufsummiert. Sie stellten Besuche nach Alter dar und passten ein nichtparametrisches, auf kubischen Splines basierendes Modell mit gemischten Effekten an, um das subjektspezifische LDL-C vom 18. bis zum 40. Lebensjahr zu schätzen, wobei Informationen aus der gesamten Kohorte einbezogen wurden. Die CARDIA-ApoB-Analyse verwendete ein analoges Spline-Modell mit gemischten Effekten und der besten linearen unverzerrten Vorhersage [1], [3]. Das Beobachtungsfenster betraf das Alter von 18 bis 40 Jahren; das Vorhersagefenster betraf das Alter von 40 bis 66 Jahren. Die Hazard Ratio von 1,053 pro 100 mg/dL·Jahren beschreibt die im ersten Fenster angesammelte Exposition zur Vorhersage von Ereignissen im zweiten. Jedes Schema, das einen einzelnen Wert zurückrechnet, linear interpoliert und trapezförmig aus spärlichen klinischen Panels integriert, ist eine unvalidierte Approximation dieser Methode – keine Implementierung davon – und jeder Koeffizient, der außerhalb des Rekrutierungsfensters von 18 bis 40 angewendet wird, wird außerhalb der Bedingungen verwendet, unter denen er geschätzt wurde. |
3.2 Kumulative ApoB-Exposition: Die direkten Beweise
Die wichtigste Einzelstudie hier analysierte 4.366 CARDIA-Teilnehmer mit NMR-bestimmter apoB-Konzentration, LDL-Partikelanzahl (LDL-P) und die Anzahl der triglyceridreichen Lipoproteinpartikel (TRL-P) über ein 22-jähriges Expositionsfenster vom 18. bis unter 40. Lebensjahr, mit 241 ASCVD-Ereignissen über eine mittlere Nachbeobachtungszeit von 19,3 Jahren [3]. Jede um 1 Standardabweichung höhere kumulative ApoB-Exposition war mit einer unbereinigten Hazard Ratio von 1,53 (95 %-KI 1,36–1,72) verbunden; nach Bereinigung um Kovariaten betrug die Hazard Ratio etwa 1,30. Die kumulativen LDL-P- und TRL-P-Werte zeigten ein nahezu identisches Verhalten (unbereinigte HRs 1,54 bzw. 1,48).
Wichtigerweise identifizierten die Autoren einen Wendepunkt: Das ASCVD-Risiko begann ab einer gewissen apoB-Exposition anzusteigen, die über dem üblichen Wert von etwa 75 mg/dL lag, wenn dieser im Alter von 18 bis unter 40 Jahren aufrechterhalten wurde. Sie schlugen apoB unter 75 mg/dL als Ziel vor, um ein geringes Risiko bei jungen Erwachsenen aufrechtzuerhalten. Ausgedrückt als Integral über dieses 22-Jahres-Fenster entspricht 75 mg/dL einem arithmetischen Äquivalent von etwa 1.650 mg/dL·Jahren (75 × 22) – eine Transformation des berichteten Referenzwerts und kein separat abgeleiteter Schwellenwert.
| Was diese Zahl von 1.650 ist und was sie nicht ist
Es handelt sich um: einen kohortenspezifischen, aus Splines abgeleiteten Referenzpunkt bei etwa 75 mg/dL, oberhalb dessen das geschätzte Ereignisrisiko über ein bestimmtes Altersfenster hinweg deutlicher erhöht war, unter Verwendung von NMR-abgeleitetem apoB. Es ist NICHT: ein validierter Schwellenwert für das Auftreten erster Plaques, für Verkalkung, für hochriskante Plaquemorphologie, oder für die erste Myokardinfarkt. Es ist NICHT: ohne Weiteres übertragbar auf den Immunoassay für ApoB, auf andere Altersgruppen oder auf Populationen mit anderen Risikofaktorprofilen. Dieses Schild als klinischen Schwellenwert ohne diesen Kontext darzustellen, hieße, ihn zu überbewerten. |
Die Variabilität der Trajektorien ist erheblich und muss modelliert statt wegdacht werden. Bei 3.055 CARDIA-Teilnehmern, die bei fünf Untersuchungen über einen Zeitraum von 30 Jahren gemessen wurden, betrug die mittlere annualisierte Rate der apoB-Veränderung 0,52 mg/dL/Jahr (SD 1,0), wobei die individuellen Raten von -6,26 bis +9,21 mg/dL/Jahr reichten [16Eine Einzelpunkt-Rückextrapolation aus einem Mittelwert im mittleren Lebensalter ist daher eine Annäherung mit einem großen Fehlerbereich, und jedes darauf aufbauende Instrument muss diese Unsicherheit verdeutlichen, anstatt sie hinter einer Punktschätzung zu verbergen.
3.3 Vorhersage speziell bei jungen Erwachsenen
In einer gepoolten Analyse von 10.519 Erwachsenen aus US-amerikanischen bevölkerungsbasierten Kohorten war ApoB bei Erwachsenen im Alter von 18 bis 39 Jahren stärker mit ASCVD assoziiert als bei Personen im Alter von 40 Jahren oder älter, und die Hinzufügung von ApoB zu dem PREVENT-Gleichungen verbessertes Risiko Umklassifizierung in der jüngeren Gruppe (kontinuierlicher NRI 0,67, 95%-KI 0,23–1,09 für das 10-Jahres-Risiko und 0,47, 95%-KI 0,02–0,84 für das 30-Jahres-Risiko), jedoch nicht in der älteren Gruppe [17Die Autoren waren entsprechend vorsichtig, dass diese Verbesserungen bescheiden waren. Dennoch ist das Richtungssignal konsistent: Je jünger der Patient, desto stärker unterschätzt die einzelne Messung das lebenslange Problem und desto stärker ist die Begründung für die Prüfung, ob eine kumulative Rahmung prädiktive Informationen hinzufügt.
4. Diskordanz: Das stärkste praktische Argument für apoB
4.1 Wie viel Diskrepanz eigentlich
Die Diskordanz ist die Situation, in der apoB und LDL-C einen Patienten in unterschiedliche Risikokategorien einteilen. Da die beiden bei den meisten Patienten stark korreliert sind, kann eine konventionelle Regression ihre prädiktiven Beiträge nicht sauber trennen; in einer großen Kohorte aus der klinischen Praxis waren apoB und die mittels NMR gemessene LDL-Partikelanzahl selbst hoch korreliert (R² = 0,79) [18]. Die Konkordanz-Analyse ist die methodische Antwort, und sie gibt es in drei Ausprägungen: Konkordanz nach klinischen Grenzwerten, nach Bevölkerungswertperzentilen und nach Regressionsresiduen [19].
Die Prävalenzschätzungen liegen alle in einem vertretbaren Bereich, und der vorläufige Wert von etwa 20% ist als Schätzung im oberen Mittelfeld für Risikogruppen angemessen, sollte jedoch eher als Spanne denn als Einzelwert angegeben werden.
| Quelle | Bevölkerung und Definition | Diskrepanzschätzung |
| De Oliveira-Gomes et al., Circulation 2024 [13] | Überprüfung über Kohorten hinweg; diskordant hohes ApoB nach verschiedenen Definitionen | 5,31 TP9T bis 24,91 TP9T, je nach Definition und Grundgesamtheit |
| CARDIA ApoB-Trajektorienanalyse, J Lipid Res 202216] | Höher oder niedriger als der Durchschnitts-ApoB für einen bestimmten Nicht-HDL-C | Etwa 8% bis 20% |
| CARDIA: Junge-Erwachsenen-Diskordanz vs. KHK [20] | ApoB im Durchschnittsalter von 25 Jahren ist aussagekräftiger für spätere Koronarkalkablagerungen (CAC) als LDL-C oder Nicht-HDL-C | 18% junger Erwachsener |
| Health-Diagnostic-Laboratory-Kohorte, n = 412.013 [18] | ApoB im Vergleich zu NMR LDL-P nach klinischen Grenzwerten | 5%–6% werden ausschließlich durch LDL-P markiert; 6%–7% ausschließlich durch ApoB |
| Kopenhagener Allgemeinbevölkerungsstudie, n = 95.108 [21] | Überschüssiges ApoB (gemessen minus LDL-C-vorhergesagt) ≥11 mg/dL | Abgestufte Schichten über das gesamte LDL-C-Spektrum |
Tabelle 2. Berichten zufolge Prävalenz einer klinisch bedeutsamen apoB/LDL-C-Diskordanz. Die Streuung spiegelt eine echte methodische Heterogenität in der Definition der Diskordanz wider, nicht Uneinigkeit darüber, ob sie existiert.
4.2 Gewinnt apoB, wenn sie sich nicht einig sind?
A systematische Übersichtsarbeit veröffentlichter Diskrepanzanalysen fassten 15 Studien und 593.354 Teilnehmer zusammen, diverse Populationen, behandelt und unbehandelt, unter Verwendung medianbasierter, perzentilbasierter, residualbasierter und varianzbasierter Definitionen. ApoB war LDL-C in 9 von 9 Vergleichen überlegen. ApoB war non-HDL-C in 7 von 9 überlegen, war in 1 gleichwertig und unterlag in 1. Die Anzahl der LDL-Partikel war LDL-C in 2 von 3 überlegen [22Das ist etwa so einseitig, wie es die Präventivkardiologie hervorbringt.
Die Copenhagen General Population Study definierte Diskordanz als “überschüssiges ApoB” – gemessenes ApoB minus das aus LDL-C allein vorhergesagte ApoB, wobei die Vorhersage aus Personen mit Triglyceriden ≤1 mmol/L abgeleitet wurde. Unter 53.484 Frauen und 41.624 Männern, die keine Statine einnahmen und über einen Median von 9,6 Jahren nachbeobachtet wurden, bei denen 2.048 Myokardinfarkte und 4.282 ASCVD-Ereignisse auftraten, war überschüssiges ApoB über das gesamte LDL-C-Spektrum hinweg dosisabhängig mit dem Risiko assoziiert [21]. Die Hazard Ratios aus dieser Analyse sind in Tabelle 3 wiedergegeben, da sie der empirische Anker für die Diskussion der Diskrepanz in Abschnitt 8 sind.
| Überschüssiges ApoB (mg/dL) | ASCVD-Risiko, Frauen | ASCVD-Risiko, Männer | Interpretation |
| <11 (Referenz) | 1.00 | 1.00 | übereinstimmend |
| 11–25 | 1.08 (0.97–1.21) | 1.14 (1.02–1.26) | Geringe Diskrepanz |
| 26–45 | 1.30 (1.14–1.48) | 1.41 (1.26–1.57) | Mäßige Diskrepanz |
| 46–100 | 1.34 (1.14–1.58) | 1.41 (1.25–1.60) | Deutliche Diskrepanz |
| >100 | 1.75 (1.08–2.83) | 1.52 (1.13–2.05) | Schwere Diskrepanz |
Tabelle 3. Multivariabel bereinigte ASCVD-Hazard-Ratios nach überschüssigem ApoB-Stratum, Kopenhagen Allgemeine Bevölkerungsschnitte (Copenhagen General Population Study) [21Die Ergebnisse waren über das gesamte LDL-C-Spektrum hinweg robust.
4.3 Der insulinresistente und diabetische Phänotyp
Diskordanz ist nicht zufällig verteilt. Sie konzentriert sich, vorhersagbar und mechanistisch, in einem metabolischen Phänotyp, der in zeitgenössischen Primärpräventionspopulationen häufig ist.
In Insulin Resistenz und Typ-2-Diabetes, hepatische VLDL-Überproduktion und gestörte Lipolyse erzeugen einen Triglycerid-reichen Pool. Cholesterinester Überweisung Protein wandelt Triglycerid in LDL um und HDL als Gegenleistung für Cholesterinester; Leberlipase hydrolysiert dann die Triglycerid-angereicherten LDL und liefert kleine, dichte, cholesterinarme LDL-Partikel. Das Ergebnis ist eine hohe Partikelanzahl, die eine normale oder sogar niedrige Cholesterinmasse transportiert. LDL-C wirkt beruhigend. ApoB tut das nicht [11], [12].
Verteilungsdaten machen das Ausmaß konkret. In einer national repräsentativen NHANES-Stichprobe von US-Erwachsenen ohne Statintherapie lag bei einem LDL-C von 100 mg/dL die ApoB-Konzentration der Hälfte der Bevölkerung zwischen 75 und 86 mg/dL (der Interquartilbereich), und ein LDL-C von 70 mg/dL entsprach einem medianen ApoB von etwa 60 mg/dL [23]. Eine stärkere positive Diskordanz – ein höherer gemessener als erwarteter ApoB-Wert – war mit einem höheren Alter, dem männlichen Geschlecht, Adipositas, Diabetes, höheren Triglyceriden, einem höheren HbA1c-Wert, der Einnahme von Statinen und einem schlechten Stoffwechselgesundheit. Bemerkenswerterweise überstieg die Variabilität innerhalb dieser Untergruppen die Unterschiede zwischen den Gruppen, was ein Argument dafür ist, ApoB zu messen, anstatt es vom Phänotyp abzuleiten.
Der Mechanismus reicht über die Partikelanzahl hinaus bis in die Kinetik der Retention. Insulinresistenz stimuliert die Synthese von Proteoglykanen mit hyperelongierten Glykosaminoglykanketten durch glatte Gefäßmuskelzellen, wodurch die Dichte der negativen Ladung in der intimalen Matrix und deren Avidität für apoB erhöht wird [8]. Die direkte Messung bestätigt eine verstärkte Retention: Das Verhältnis von ApoB in der interstitiellen Flüssigkeit zu dem im Serum ist bei Typ-2-Diabetes signifikant niedriger als bei Kontrollpersonen, was eher mit einem stärkeren subothelialen Einschließung als mit einer lymphatischen Clearance vereinbar ist [24Diese Ergebnisse stützen die Möglichkeit, dass Diabetes das Risiko sowohl durch eine größere Partikelbelastung pro Cholesterineinheit als auch durch Veränderungen der Arterienwand erhöht, die eine Retention begünstigen können, sobald die Partikel ankommen.
Ein diskordant hoher ApoB-Wert ist zudem unabhängig mit dem Vorliegen von assoziiert chronische Nierenerkrankung in Querschnittsdaten. Bei 13.767 NHANES-Teilnehmern wiesen diejenigen mit niedrigem LDL-C und hohem ApoB im Vergleich zur Gruppe mit entsprechend niedrigen Werten den stärksten Zusammenhang mit einer präsenten chronischen Nierenerkrankung (CKD) auf (OR 1,12, 95%-KI 1,08–1,16), zusammen mit den höchsten Nüchternwerten Glucose, Insulin und HOMA-IR Werte25].
4.4 Das stärkste Gegenargument, fair dargelegt
Die Leitlinie mehrerer Fachgesellschaften aus dem Jahr 2026 bringt einen methodischen Punkt vor, mit dem sich jeder Befürworter von ApoB direkt auseinandersetzen muss: Wenn LDL-C mit der Martin/Hopkins-Gleichung anstelle der Friedewald-Formel geschätzt wird, ist die gemessene Prävalenz von LDL-C/apoB-Diskordanz sinkt deutlich4Ein signifikanter Anteil der gemessenen historischen Diskrepanz war auf eine Schätzgleichung aus dem Jahr 1972 zurückzuführen, die ein festes Verhältnis von Triglyceriden zu VLDL-Cholesterin von 5:1 annimmt – eine Annahme, die gerade bei den hypertriglyceridämischen, insulinresistenten Patienten versagt, bei denen die Diskrepanz Berichten zufolge am größten war.
Dies entkräftet das Argument für ApoB nicht, relativiert es aber. Die ehrliche Position ist, dass ein Teil des historischen Diskordanzsignals eher die Methode zur Schätzung des LDL-C als die Partikelbiologie widerspiegelt, während ein Teil auf eine echte biologische Diskordanz zurückzuführen ist, und dass die verbleibende tatsächliche Diskordanz geringer ist, als die ältere Literatur vermuten lässt. Das Argument der direkten Messung bleibt intakt: ApoB erfordert keine Schätzgleichung, ist unabhängig vom Nüchternstatus und analytisch standardisiert. Ein zweites Gegenargument verdient dieselbe Offenheit – die ATTICA-Kohle zeigte, dass ein erhöhtes ApoB das 20-Jahres-ASCVD-Risiko unabhängig voraussagte, dies jedoch hauptsächlich bei gleichzeitig erhöhtem LDL-C, was die Behauptung dämpft, dass ApoB routinemäßig das Risiko erfasst, das LDL-C vollständig übersieht [26].
5. Von der Exposition bis zur Plaque
Der Zusammenhang zwischen kumulativer Exposition und anatomischen Erkrankungen stützt sich auf Autopsiebefunde, Längsschnittstudien mit Bildgebungsdaten sowie Interventionsstudien.
Der PDAY (Pathobiologische Determinanten von Arteriosklerose Im Rahmen der „in Youth“-Studie stellten die Forscher fest, dass Atherosklerose bereits im Kindesalter beginnt und dass herkömmliche Risikofaktor-Scores mit den frühesten anatomisch nachweisbaren Läsionen bei Menschen im Alter von 15 bis 34 Jahren, nicht nur bei fortgeschrittener Erkrankung [27]. In der primären PDAY-Autopsieserie mit 1.079 Männern und 364 Frauen im Alter von 15 bis 34 Jahren, die an äußeren Ursachen verstorben waren, betrug das Ausmaß der von Fettstreifen und erhabene Läsionen im Aorta und die Koronararterie rechts stieg mit zunehmendem Alter an, stand in einem positiven Zusammenhang mit der VLDL-plus-LDL-Cholesterinkonzentration und in einem negativen Zusammenhang mit dem HDL-Cholesterin [28]. Das Bogalusa-Herz-Studie zeigte, dass das Ausmaß der Fettstreifen und fibrösen Plaques in der Aorta und den Koronararterien mit der Anzahl der vorliegenden Risikofaktoren zunahm, einschließlich der LDL-bezogenen Messwerte [29]. Dies sind die Beobachtungen, die die Sichtweise der lebenslangen Exposition nicht nur als elegant, sondern auch als biologisch fundiert erscheinen lassen.
Die bildgebende Langzeitbeobachtung schafft eine Brücke zwischen der Anatomie junger Menschen und der im mittleren Lebensalter. In der CARDIA-Studie sagten die im jungen Erwachsenenalter gemessenen PDAY-Risikowerte die Kalziumablagerungen in den Koronararterien und der Bauchaorta zwei Jahrzehnte später voraus [30]. In der Kohorte „Cardiovascular Risk in Young Finns“ ließ sich anhand der im Jugendalter auftretenden Risikofaktoren der Kalziumgehalt in den Koronararterien im Erwachsenenalter vorhersagen [31]. In keiner der beiden Studien wurden ApoB-Jahre berechnet, doch beide stehen im Einklang mit der kumulativen Belastung als maßgeblicher Variable.
Es bestehen ApoB-spezifische Zusammenhänge mit Plaques. In MESA, über einen Medianzeitraum von 9,4 Jahren war ein ApoB-Wert im obersten Quartil mit einer Progression der Karotis-Plaques assoziiert, nachdem eine Bereinigung um LDL-C sowie um Gesamt- und HDL-Cholesterin vorgenommen worden war; allerdings verlor dieser Zusammenhang an Signifikanz, wenn alle Lipid-Kovariablen gemeinsam berücksichtigt wurden (p = 0,086) – ein Hinweis, wenn auch kein eigenständiger [32]. In der Atherosclerosis and Insulin Resistance (AIR)-Studie war ein hohes ApoB/ApoA-I-Verhältnis mit einer höheren Dreijahres-Progressionsrate der Karotis-Atherosklerose verbunden Intima-Media-Dicke bei klinisch gesunden 58-jährigen Männern [33].
| Die Lücke, die anerkannt werden muss
Es gibt keinen validierten ApoB-Jahre-Schwellenwert für: die erste nachweisbare Plaque, frühe Fibroatherom, positives Remodeling, Beginn einer Verkalkung, Morphologie einer Hochrisiko-Plaque oder erster Herzinfarkt. In Sekundärquellen und Online-Quellen sind zahlreiche Tabellen im Umlauf, in denen diesen Meilensteinen bestimmte ApoB-Jahres- oder LDL-Jahreswerte zugeordnet werden. Diese Zahlen lassen sich nicht auf primäre, von Fachkollegen begutachtete Ableitungen zurückführen und sollten daher nicht in einem klinischen Instrument wiedergegeben werden. Man kann mit Fug und Recht behaupten, dass jeder Einzelne im Grunde genommen eine persönliche Plaque-Schwellenwert — Die kumulative Exposition steht in Wechselwirkung mit der erblich bedingten Anfälligkeit für Arterienerkrankungen, dem Blutdruck und dem Blutzuckerspiegel, Rauchen, Nierenfunktion, Entzündungen und Lp(a), sodass die Exposition, bei der Plaques auftreten, von Person zu Person erheblich variiert. |
6. Die Plaque-Belastung ist das Substrat; Ereignisse erfordern einen Auslöser
Die Verwechslung von Plaque-Belastung und Ereignisrisiko ist ein häufiger konzeptioneller Fehler, und jede vorgeschlagene Messgröße muss diese Unterscheidung klar hervorheben. Die Plaquebildung ist ein stufenweiser, konzentrationsabhängiger Prozess, wenn auch ein heterogener und probabilistischer: Zwei Personen mit derselben kumulativen Exposition können je nach Blutdruck, Rauchen, Blutzuckerspiegel, Genetik, Lp(a), arterielle Geometrie, Entzündung und lokale Endothelbiologie. Akute Ereignisse sind Schwellenwertüberschreitungsphänomene, die eine anfällige Läsion, einen mechanischen oder entzündlichen Auslöser sowie ein thrombogenes Milieu erfordern.
Die PROSPECT-Studie zeigte, dass zukünftige Ereignisse häufig auf Läsionen zurückzuführen waren, die zu Studienbeginn angiographisch als leicht eingestuft wurden – im Durchschnitt Durchmesserstenose etwa 32% – die jedoch eine hohe Plaque-Belastung, eine geringe Lumenfläche oder dünnkappiges Fibroatherom Morphologie bei der intravaskulären Bildgebung [34]. Die PROSPECT-II-Studie zeigte, dass lipidreiche Plaques Eine hohe Plaque-Belastung war ein unabhängiger Prädiktor für Ereignisse an Nicht-Verursacher-Läsionen: Patienten mit mindestens einer Läsion, die sowohl eine hohe Plaque-Belastung als auch eine große Lipidkern wies eine vierjährige MACE-Rate von 13,21 TP9T auf, die nicht mit der nicht-verursachenden Läsion in Zusammenhang stand, während die entsprechende Rate auf Läsionsebene bei 7,01 TP9T lag [35]. Diese Unterscheidung ist von Bedeutung, und die Zahl hat zwei Seiten: Sie ist klinisch relevant, bedeutet aber auch, dass die große Mehrheit der Hochrisikoläsionen über einen Zeitraum von vier Jahren kein Ereignis ausgelöst hat.
In der CT-Angiographie hat SCOT-HEART gezeigt, dass Plaque mit niedriger Dämpfung Belastung als stärkster Prädiktor für einen nachfolgenden Myokardinfarkt, was einen Mehrwert über Kalkscore und obstruktiv Stenose [36]. In einer späteren SCOT-HEART-Analyse wies eine Plaque-Belastung mit geringer Dämpfung über 4% ein Hazard Ratio von 4,87 für tödliche oder nicht-tödliche Herzinfarkte auf, während eine Dämpfung des perikoronaren Fettgewebes ein Hazard Ratio von 2,45 aufwies; wobei die Kombination beider Faktoren die Gruppe mit dem höchsten Risiko identifizierte und die Fläche unter der Kurve von 0,71 für Plaques mit geringer Dämpfung allein auf 0,75 für die Kombination erhöhte [37]. Akute Koronarsyndrome haben verschiedene Ursachen, die sich aus Plaque-Ruptur, Plaque-Erosion, sowie verkalkte Knötchen; insbesondere Erosionen können bereits bei mäßiger Plaquebelastung und nahezu normalem angiographischem Erscheinungsbild auftreten, jedoch immer noch auf einem atherosklerotischen Substrat [38].
Zwei Korrekturen zu der Art und Weise, wie dies häufig zusammengefasst wird, sind angebracht. Erstens lässt sich dieser Zusammenhang am besten als Heuristik und nicht als Modell beschreiben: Die Plaque-Belastung definiert das anatomische Substrat und schränkt die Wahrscheinlichkeit eines Ereignisses stark ein, während der Läsionsphänotyp, lokale biomechanische Belastungen, systemische Entzündungen und Thrombogenität beeinflussen, ob und wann ein akutes Ereignis auftritt. Die Darstellung als Produkt aus drei Termen ist ein nützliches Schema, jedoch keine etablierte quantitative Beziehung, und sollte auch nicht als solche präsentiert werden.
Zweitens kann die Betonung der Vulnerabilität dazu führen, dass unterschätzt wird, wie stark die Gesamtplaquebelastung selbst Ereignisse vorhersagt. Moderne Bildgebungsdaten stufen die Gesamtbelastung als einen der stärksten verfügbaren Prädiktoren ein, und der Grund dafür ist einfache Arithmetik: Je mehr Plaque eine Person in sich trägt, desto mehr Läsionen gibt es, die reißen oder erodieren könnten; desto größer ist die Wahrscheinlichkeit, dass mindestens eine davon eine ungünstige Morphologie aufweist; desto größer ist die entzündete und thrombogene Arterienoberfläche; und desto höher ist die Wahrscheinlichkeit einer obstruktiven Progression. Diese Kette lässt sich am besten wie folgt darstellen: kumulative ApoB-Exposition → Plaque-Belastung und Plaque-Phänotyp → Anzahl und Phänotyp der Läsionen → Wahrscheinlichkeit eines Ereignisses. Diese Kette stellt eher ein kausales Rahmenkonzept dar als ein validiertes quantitatives Mediationsmodell. Die kumulative Exposition steht in engem Zusammenhang mit dem Lebenszeitrisiko für ein Ereignis; sie lässt jedoch weitaus weniger Rückschlüsse darauf zu, welche Plaque im nächsten Jahr zu einem Ereignis führen wird.
7. Rückgang: Kann die kumulierte Belastung wieder abgebaut werden?
Die klinische Relevanz einer Expositionskennzahl hängt zum Teil davon ab, ob eine Verringerung der zukünftigen Akkumulation Auswirkungen auf die bestehende Erkrankung hat. Die Studien zur intravaskulären Bildgebung beantworten diese Frage bejahend, wobei sie eine wichtige Korrektur zu einer Behauptung vornehmen, die in Sekundärquellen häufig auftaucht.
GLAGOV 968 Patienten mit symptomatischer Koronarerkrankung wurden randomisiert in folgende Gruppen eingeteilt: Evolocumab oder Placebo unter einer begleitenden Statintherapie. Der im Evolocumab-Arm erreichte mittlere LDL-C-Wert betrug 36,6 mg/dl, und Atheromvolumen in Prozent Veränderung um −0,95% gegenüber keiner signifikanten Veränderung unter Statin plus Placebo [39]. Dieser Wert von −0,95% ist ein Mittelwert der Behandlungsgruppe, der mit erheblicher individueller Heterogenität einhergeht; er bedeutet nicht, dass bei jedem Teilnehmer ein Rückgang zu verzeichnen war. PACMAN-AMI hinzugefügt Alirocumab zu hochdosiertes Statin nach einem akuten Myokardinfarkt und unter Verwendung von Serieller IVUS, NIRS und OCT, stellten eine “dreifache Regression” fest – eine gleichzeitige Abnahme des prozentualen Atheromvolumens, eine Abnahme des maximalen Lipidkern-Belastungsindex und einen Anstieg des minimalen faserige Kappe Dicke – in der Alirocumab-Gruppe bei 40,81 TP9T gegenüber 23,01 TP9T in der Placebo-Gruppe (p = 0,002), wobei die Gruppe mit dreifacher Regression einen mittleren LDL-C-Wert von 38,4 mg/dl gegenüber 55,7 mg/dl erreichte [40].
| Richtigstellung einer vielfach wiederholten Behauptung
Häufig wird ein Wert von 70 mg/dL als angestrebter LDL-C-“Grenzwert” genannt, unterhalb dessen koronare Plaquerückbildung wird deutlicher. Die Primärdaten sprechen nicht für einen Schwellenwert. Eine Post-hoc-Analyse der GLAGOV-Studie zeigte eine Regression der Koronarplaques, die direkt proportional zum erreichten LDL-C-Wert war, wobei bis zu einem Wert von etwa 20 mg/dl keine offensichtliche Änderung der Steigung zu beobachten war; entsprechende Analysen der intensiven PCSK9 Hemmung, einschließlich Huygens bei akuten Koronarsyndromen deuten auf einen anhaltenden positiven Effekt auf die Plaques bei einem sehr niedrigen erreichten LDL-C-Wert hin [39], [41]. Die zutreffende Aussage ist enger gefasst: Innerhalb des untersuchten Bereichs der erreichten LDL-C-Werte konnten diese Analysen weder einen eindeutigen unteren Schwellenwert noch eine Änderung der Steigung für die Plaquerückbildung feststellen. Das ist die Beobachtung; sie ist jedoch kein Beweis dafür, dass der Nutzen auf unbestimmte Zeit vollkommen linear bleibt oder dass jeder Patient bei den niedrigsten erreichten Werten gleichermaßen davon profitiert. |
Auf der Ebene der klinischen Studien scheint die Regression die Ergebnisse abzubilden. Eine systematische Übersichtsarbeit und Metaregression von 17 prospektiven Studien zur Dyslipidämie-Therapie (6.333 Patienten) ergab, dass eine Verringerung des mittleren prozentualen Atheromvolumens um 1% mit einem um 20% geringeren MACE-Risiko assoziiert war (bereinigtes OR 0,82, 95% KI 0,70–0,95, p = 0,011) [42]. Dieser Zusammenhang besteht zwischen den Mittelwerten auf Studienebene. Er erlaubt nicht den Schluss, dass eine Senkung des Atheromvolumens eines einzelnen Patienten um 1% das Ereignisrisiko dieses Patienten um 20% verringert – das wäre eine Extrapolation von der populationsbezogenen auf die individuelle Ebene. Ob die Veränderung des ApoB-Jahre-Verlaufs mit der seriellen Veränderung des Plaquevolumens korreliert und ob diese Veränderung den klinischen Nutzen vermittelt, bleibt eine offene Frage für das Validierungsprogramm in Abschnitt 11.
Zwei Vorbehalte dämpfen den Optimismus. Der Rückgang von Plaquevolumen ist in absoluten Zahlen gering und wurde über einen Zeitraum von ein bis zwei Jahren bei Patienten mit etablierter Erkrankung nachgewiesen; sie lässt sich nicht auf die Umkehrung durch jahrzehntelang angesammelte Belastungen. Und die genetischen Belege belegen eine Asymmetrie, die kein Regressionsversuch überwinden kann: Ein lebenslang genetisch bedingter niedrigerer LDL-C-Spiegel führt zu einer Risikominderung, die um ein Vielfaches größer ist als die gleiche Reduktion, die durch eine fünfjährige medikamentöse Therapie im mittleren Lebensalter erreicht wird [43]; Erkenntnisse aus der Mendelschen Randomisierung stützen dieselbe Logik der lebenslangen Exposition speziell für ApoB [44]. Eine vermiedene Exposition ist wertvoller als eine behandelte. Diese Asymmetrie ist das Hauptargument dafür, die kumulative Exposition frühzeitig zu messen, anstatt erst spät auf das Überschreiten eines Schwellenwerts zu reagieren.
8. Die kumulative ApoB-Exposition als deskriptiver Indikator – und die Hindernisse für die individuelle Risikobewertung
In diesem Abschnitt wird dargelegt, was sich aus der ApoB-Entwicklung einer Person ableiten lässt, und ebenso präzise wird dargelegt, was sich daraus noch nicht ableiten lässt. Diese Unterscheidung ist der Kern der Arbeit: Eine beschreibende Expositionsgröße ist vertretbar; ein daraus abgeleiteter individueller Risikowert hingegen nicht.
8.1 Die beschreibende Größe
ABY = ∫ apoB(t) dt über ein definiertes Altersfenster (mg/dL·Jahre)
Die kumulative ApoB-Exposition ist eine legitime beschreibende Größe: die Fläche unter der ApoB-gegen-Alter-Kurve einer Person über einen festgelegten Zeitraum. Sie sollte, soweit möglich, aus gemessenen seriellen ApoB-Werten berechnet, für den Alterszeitraum angegeben werden, in dem sie tatsächlich gemessen wurde, und mit dem Anteil des Integrals versehen werden, der auf Messungen und nicht auf Imputationen beruht. Die aus imputierten ApoB-Werten abgeleitete Exposition sollte separat angegeben und niemals in einen einzigen Gesamtwert einbezogen werden, da die Imputation ein für die Population medianes Partikel-Cholesterin-Verhalten voraussetzt – genau jene Annahme, die bei den Patienten mit Diskordanzen, die mit dieser Metrik identifiziert werden sollen, nicht zutrifft.
Ein Vergleich mit dem aus der CARDIA-Studie abgeleiteten Referenzwert von etwa 75 mg/dL ist im Alter von 18 bis 40 Jahren aussagekräftig – dem Zeitraum, in dem dieser aus einer Spline-Kurve abgeleitete Referenzwert beobachtet wurde. Ab einem Alter von 40 Jahren hat der Referenzwert keine Anknüpfungspunkte mehr: Nichts belegt, dass 75 mg/dL bei 55, 70 oder 85 Jahren der geeignete Vergleichswert ist, dass eine Person, die diesen Wert geringfügig überschreitet, eine nennenswerte Expositionsschuld angehäuft hat, dass 75 einen biologischen Null-Risiko-Wert darstellt oder dass die Beziehung nach dem 40. Lebensjahr konstant bleibt. Die Quelle beschreibt diesen Wert als einen, der ein Ziel für junge Erwachsene darstellen könnte – wesentlich schwächer als ein lebenslanger Bezugswert.
8.2 Warum sich das Risiko nicht in einen Risikomultiplikator umwandeln lässt
Die natürliche Versuchung besteht darin, einen veröffentlichten Risikokoeffizienten für die kumulative Exposition – wie beispielsweise Domanskis Wert von 1,053 pro 100 mg/dL·Jahre kumulativer LDL-C-Exposition – zu nehmen und ihn über die gesamte Lebensdauer einer Person zu potenzieren, um einen persönlichen Risikomultiplikator zu erhalten. Dieser Schritt ist aus mehreren unabhängigen Gründen ungültig, von denen bereits jeder einzelne ausreicht.
- Ein Cox-Hazard-Verhältnis wird relativ zu einem modellierten Vergleich und dem Basis-Hazard der Studie definiert. Die Potenzierung ausgehend von einer lebenslangen Exposition von Null impliziert einen Vergleichswert – eine Person, die keinerlei Exposition gegenüber atherogenen Partikeln erfahren hat –, der physiologisch nicht existiert, und lässt den Modell-Achsenabschnitt, die Verteilung der Kovariaten, konkurrierende Risiken sowie die Kohortenkalibrierung außer Acht.
- Selbst wenn man sich nicht an Null, sondern an einen Referenzwert ungleich Null orientiert, ergibt sich unter den Annahmen des ursprünglichen Modells ein kohortenrelativer Zusammenhang und kein Multiplikator auf Patientenebene, und dieser kann nicht mit einem validierten Instrument wie PREVENT verknüpft werden.
- Der Koeffizient wurde auf der Grundlage der zwischen dem 18. und 40. Lebensjahr aufgelaufenen Exposition geschätzt, um Ereignisse im Alter von 40 bis 66 Jahren vorherzusagen. Bei Anwendung auf die über das gesamte Leben aufgelaufene Exposition wird er außerhalb der Rahmenbedingungen seiner Herleitung verwendet.
- Um den Multiplikator zu ermitteln, müssten die ApoB-Jahre anhand einer auf der Bevölkerungsebene geltenden Beziehung in LDL-Jahre umgerechnet werden – genau jene Beziehung, von der diese Arbeit argumentiert, dass sie bei den Personen, zu deren Identifizierung die Kennzahl dient, nicht zutrifft.
Es sollte kein Ereignis-Risiko-Multiplikator aus der kumulativen ApoB-Exposition abgeleitet werden, solange nicht in einer Kohorte mit seriellen ApoB-Messungen ein solcher direkt abgeleitet und extern validiert wurde.
8.3 Warum eine einzelne Messung nicht auf das 18. Lebensjahr zurückgerechnet werden kann
Bei den meisten Patienten liegen keine Lipidwerte aus der Jugend vor, was dazu führt, dass der frühe Verlauf anhand eines späteren Wertes unter Verwendung einer populaionsdurchschnittlichen jährlichen ApoB-Steigung rekonstruiert werden muss. Auf individueller Ebene funktioniert dies jedoch nicht.
- Ein Populationsmittelwert ist kein individueller Verlauf. Wendet man ihn rückwirkend über Jahrzehnte hinweg an, führt dies bei jedem, dessen ApoB-Wert sich aus einem bestimmten Grund verändert hat – Gewichtsveränderung, Ausbruch von Diabetes, Menopause, Beginn oder Beendigung einer Therapie, Schilddrüsen- oder Nierenerkrankung.
- Die Standardabweichung der beobachteten personenübergreifenden Steigungen entspricht nicht dem Standardfehler einer personenspezifischen Rückrechnung. Die Multiplikation einer personenübergreifenden Standardabweichung über mehrere Jahrzehnte hinweg führt zu einem breiten Intervall, jedoch nicht zu einem korrekt geschätzten Vorhersageintervall.
Die CARDIA-ApoB-Verlaufsanalyse kam direkt zu diesem Ergebnis: Die erheblichen Schwankungen des ApoB-Spiegels im Zeitverlauf und der nur geringe Zusammenhang zwischen den Ausgangswerten und den Veränderungsraten bedeuten, dass die Vorhersage der zukünftigen ApoB-Konzentration einer Person – und damit ihrer kumulativen Exposition – anhand einer einmaligen Messung nur eine geringe Genauigkeit aufweist [16]. Fehlen frühe Messwerte, besteht das angemessene Ergebnis aus einer Reihe klar gekennzeichneter Sensitivitätsszenarien – ein stabiles, lebenslanges Niveau, ein allmählicher altersbedingter Anstieg, eine späte Stoffwechselverschlechterung –, die nebeneinander als Sensitivitätsanalysen und nicht als konkurrierende Schätzungen der tatsächlichen Vorgeschichte der Person dargestellt werden. Es sollte keine einzelne rekonstruierte zentrale Schätzung erstellt werden.
8.4 Warum Hazard Ratios mit Diskordanz nicht einfach übernommen oder kombiniert werden können
Die Hazard Ratios für das überschüssige ApoB aus der Kopenhagener Studie (Abschnitt 4.2) sind ein echtes und nützliches Signal, doch ihre Verwendung unterliegt zwei Einschränkungen. Erstens sind sie relativ zu einem bestimmten Residualwert definiert: dem in Kopenhagen abgeleiteten erwarteten ApoB-Wert, der durch Regression von ApoB auf LDL-C ermittelt wurde – getrennt nach Frauen und Männern – bei Teilnehmern mit Triglyceridwerten von 1 mmol/L (89 mg/dL) oder darunter. Die Grenzwerte der Kategorien und ihre Hazard Ratios sind in Bezug auf diesen Residualwert definiert; würde man also eine andere Gleichung für den erwarteten ApoB-Wert einsetzen, würde sich ändern, wer in welche Kategorie fällt, und die Hazard Ratios würden die klassifizierten Patienten nicht mehr zutreffend beschreiben. Jede Verwendung der Kopenhagener Kategorien muss deren tatsächliche geschlechtsspezifische Regressionen reproduzieren und darf sich nicht auf eine Annäherung beschränken.
Zweitens dürfen die Hazard-Ratios aus Kopenhagen nicht mit dem Hazard-Ratio für die kumulative Exposition nach Domanski multipliziert werden, um einen zusammengesetzten Wert zu bilden. Die beiden Expositionen überschneiden sich biologisch und statistisch; ihre Multiplikation setzt Unabhängigkeit voraus und führt zu einer Doppelzählung desselben partikelbedingten Risikos. Eine gemeinsame Schätzung würde erfordern, dass beide Variablen in ein einziges Modell einfließen, wobei Kollinearität und Wechselwirkungen bewertet, eine kohortenspezifische Kalibrierung vorgenommen und eine externe Validierung durchgeführt werden müssten – und nicht einfach das Produkt zweier Hazard-Ratios aus unterschiedlichen Kohorten.
8.5 Warum sich eine Veränderung des Zahnbelags nicht in eine Verringerung einzelner Ereignisse umrechnen lässt
Der in den Studien festgestellte Zusammenhang zwischen der mittleren Plaqueregression und der mittleren Ereignisreduktion (Abschnitt 7) ist ökologischer Natur. Er bezieht sich auf Gruppenmittelwerte über verschiedene Studien hinweg. Er belegt nicht, dass eine Senkung des Atheromvolumens eines bestimmten Patienten um einen Prozentpunkt das Ereignisrisiko dieses Patienten um einen festen Betrag verringert; er lässt sich nicht auf andere als die untersuchten Populationen und Behandlungen übertragen und geht davon aus, dass die Veränderung des Plaquevolumens den gesamten Behandlungseffekt erfasst. Die Übertragung auf eine individuelle Ereignisprognose stellt einen „ökologisch-individuellen Fehler“ dar. Ob die Veränderung des ApoB-Jahre-Verlaufs mit der seriellen Veränderung des Plaquevolumens korreliert und ob diese Veränderung den klinischen Nutzen vermittelt, ist eine Frage für das Validierungsprogramm in Abschnitt 11 und keine Berechnung, die heute durchgeführt werden sollte.
8.6 Was ein Forschungsindex enthalten darf und was nicht
Ein begrenzter Forschungsindex der oben genannten Form – die kumulative gemessene ApoB-Exposition über einen definierten Zeitraum, angegeben mit dem Anteil der gemessenen gegenüber den imputierten Werten und, für die Altersgruppe von 18 bis 40 Jahren, einem Verhältnis zur CARDIA-Referenz – ist ein sinnvolles Ziel, das es zu definieren und anschließend zu testen gilt. Was er jedoch nicht enthalten darf, solange nicht jeder dieser Bestandteile separat abgeleitet und validiert wurde, ist ein Ereignis-Risiko-Multiplikator, eine Zusammensetzung aus sich überschneidenden Hazard-Ratios, eine rückwirkende zentrale Schätzung, eine prognostizierte Plaque- oder Ereignisentwicklung oder klinische Risikokategorien, die empfohlene Maßnahmen beinhalten. Mögliche Expositionsbereiche können zum Zweck der Überprüfung vorab festgelegt werden, doch einem Forschungsanalyseplan ist besser gedient, wenn Quantile oder kontinuierliche Spline-Terme vordefiniert werden, anstatt beschriftete Kategorien zu erfinden, die ungeachtet etwaiger beigefügter Haftungsausschlüsse als validierte Risikostufen interpretiert werden.
9. Validierungsstatus: Was dies nicht ist
In diesem Abschnitt wird klar dargelegt, was die deskriptive Messgröße nicht ist, damit kein Leser sie mit einem validierten Risikoinstrument verwechselt.
- Weder „ApoB-Jahre“ noch „LDL-Jahre“ sind validierte klinische Messgrößen. Keine der in Abschnitt 10 untersuchten Leitlinien operationalisiert oder empfiehlt eine Berechnung der kumulativen Exposition für die Routineversorgung.
- Mögliche Expositionsbereiche werden durch Extrapolation ausgehend von einem einzigen Referenzpunkt einer Kohorte ermittelt, der im Alter von 18 bis 40 Jahren beobachtet wurde. Sie wurden noch nie anhand von Endpunkten überprüft, und in dieser Arbeit werden ihnen keine klinischen Maßnahmen zugeordnet.
- Die rückwirkende Ermittlung der frühen Strahlenexposition einer Person ist mit einer Unsicherheit behaftet, die bei vielen Patienten die Breite jedes in Frage kommenden Bandes übersteigen würde. Dies ist das größte technische Hindernis für eine retrospektive Messung der kumulativen Strahlenexposition, und es lässt sich nicht durch bessere statistische Methoden lösen – es erfordert Lipiddaten, über die die meisten Erwachsenen nicht verfügen.
- Jede Umrechnung von ApoB in LDL-C geht davon aus, dass das Verhalten eines Einzelnen dem Median der Population entspricht – genau diese Annahme trifft bei den Patienten mit abweichenden Werten nicht zu, zu deren Identifizierung diese Kennzahl dient. Die imputierte Exposition muss daher getrennt von der gemessenen Exposition ausgewiesen und nicht mit dieser vermischt werden.
- Die kumulative Exposition, die mittels Trapezintegration aus spärlichen klinischen Datensätzen berechnet wurde, ist nicht die Größe, auf die sich die veröffentlichten Hazard-Ratios beziehen. Diese wurden aus splinebasierten gemischten Modellen abgeleitet, bei denen Informationen aus der gesamten Kohorte herangezogen wurden. Die beiden Größen wurden nie miteinander verglichen.
- Die kumulative Exposition steht in einem biologischen und epidemiologischen Zusammenhang mit der anatomischen Krankheitslast, doch ihre Eignung zur Vorhersage des Plaqueverlaufs bei einer einzelnen Person wurde bislang nicht direkt validiert, und sie ist hinsichtlich der Vorhersage des Zeitpunkts klinischer Ereignisse besonders begrenzt. Die hier vorgeschlagene Messgröße sollte keine bildgebenden Verfahren ersetzen, wenn diese für die anatomische Risikobewertung unabhängig davon klinisch indiziert sind.
Die angemessene Einstufung ist daher ein deskriptives Forschungsinstrument, das eine Variable sichtbar macht, deren Bedeutung Kliniker bereits anerkennen, und zwar zusätzlich zu – niemals anstelle von – den validierten Instrumenten (den PREVENT-Gleichungen, den in Leitlinien festgelegten Lipidzielen sowie der Koronarkalkmessung oder der CT-Angiographie, sofern diese unabhängig davon indiziert sind). Sie sollte keine Risikoeinschätzung, keine Kategorisierung und keine Handlungsempfehlung enthalten, bis diese jeweils abgeleitet und extern validiert wurden.
10. Leitlinie zur Flugbahn
Die Bewegung gemäß den Leitlinien stützt das Konzept der kumulativen Exposition. Sie bestätigt weder die Berechnung der ApoB-Jahre noch historische Rückrechnungen, Expositionsverhältnisse oder expositionsbasierte Behandlungsschwellenwerte, und diese Unterscheidung sollte klar beibehalten werden.
Die ACC/AHA/multisociety-Leitlinien von 2026 Dyslipidämie Die Leitlinie tritt in Kraft und ersetzt die Cholesterin-Leitlinie aus dem Jahr 2018; ihr Titel wurde geändert, um atherogene Lipoproteine über LDL-C hinaus zu berücksichtigen, darunter triglyceridreiche Restpartikel und Lp(a) [4]. Es ersetzt das Pooled Cohort Equations mit den PREVENT-ASCVD-Gleichungen, die sowohl das 10-Jahres- als auch das 30-Jahres-Risiko abschätzen – ein ausdrücklich auf die gesamte Lebensdauer ausgerichteter Ansatz. Es führt absolute LDL-C-Zielwerte nach Risikostufen (<100, <70 und <55 mg/dl) wieder ein. Es empfiehlt eine Lp(a)-Messung mindestens einmal im Leben jedes Erwachsenen. Es befürwortet eine selektive ApoB-Messung zur Beurteilung der verbleibenden atherogenen Partikelbelastung, insbesondere bei Patienten mit Triglyceridwerten über 200 mg/dl, Diabetes oder einem erreichten LDL-C-Wert unter 70 mg/dl. Und ihr zentraler Ansatz – frühzeitiges Eingreifen zur Verringerung einer anhaltenden Exposition – ist im Grunde nichts anderes als das Argument der kumulativen Exposition [5], [45].
Der Expertenkonsens der National Lipid Association aus dem Jahr 2024 ging speziell in Bezug auf ApoB noch einen Schritt weiter und schlug ApoB-Grenzwerte von 60, 70, und 90 mg/dL für Patienten mit sehr hohem, hohem bzw. grenzwertigem bis mittlerem Risiko vorschlug und feststellte, dass ApoB und Nicht-HDL-Cholesterin das Risiko genauer stratifizieren als LDL-Cholesterin, wenn die Messwerte voneinander abweichen [46]. In den ESC/EAS-Leitlinien von 2019 wird ApoB für die Risikobewertung eine Empfehlung der Klasse I, Stufe C gegeben, vorzugsweise bei Metabolisches Syndrom, Diabetes, Adipositas und einen sehr niedrigen LDL-C-Wert und ermöglichen dessen Einsatz als primäre Messgröße für Vorsorge, Diagnose und Behandlung [47]. Die Canadian Cardiovascular Society empfiehlt ebenfalls ApoB oder Non-HDL-C als bevorzugte Screening-Marker bei Hypertriglyceridämie [48].
Keine der hier untersuchten Fachgesellschaften oder Leitlinien wendet eine Berechnung der kumulativen Exposition an. Die biologischen Grundlagen finden zunehmend Anerkennung; die Berechnungsgrundlage wurde jedoch noch nicht abgeleitet, kalibriert oder validiert. Diese Lücke soll das Forschungsprogramm in Abschnitt 11 schließen – und dies geschieht nicht durch den Vorschlag einer Formel.
11. Ein Validierungsprogramm
Die folgenden Maßnahmen würden „ApoB-Jahre“ vom Konzept in die Praxis umsetzen, geordnet nach steigenden Kosten.
Stufe 1 – Retrospektive Ableitung aus bestehenden Kohorten
Zu den Studienkohorten gehören CARDIA, MESA, Framingham Offspring, die Kopenhagener Allgemeinbevölkerungsstudie und UK Biobank. Die Eignung hängt von der Verfügbarkeit, dem Zeitpunkt, der Untersuchungsmethode und der Dichte der seriellen ApoB-Messungen sowie der gelagerten Proben ab, die sich erheblich voneinander unterscheiden und anhand der eigenen Datendokumentation jeder Kohorte ermittelt werden müssen, bevor diese Kohorte für diese Analyse herangezogen wird. Ist diese Bedingung erfüllt, berechnen Sie die kumulative Exposition ausschließlich anhand der gemessenen seriellen ApoB-Werte – und zwar mit demselben splinebasierten Mixed-Model-Ansatz, der in den Quellanalysen verwendet wurde, sowie separat mittels trapezförmiger Integration aus einer bewusst ausgedünnten Teilmenge von Besuchen, die die tatsächliche klinische Dichte nachahmt. Der Vergleich dieser beiden Ansätze ist an sich bereits eine notwendige Untersuchung: Er stellt fest, ob eine klinisch berechenbare Näherung den Wert wiedergibt, den die veröffentlichten Hazard-Ratios beschreiben. Anschließend sind die Diskriminanz und Kalibrierung für neu auftretende ASCVD im Vergleich zum Current-Value-Modell zu testen, wobei die inkrementelle C-Statistik, die Netto-Reklassifizierung und die integrierte Diskriminanz gegenüber PREVENT quantifiziert werden. Die zu widerlegende Nullhypothese lautet, dass die kumulative Exposition nichts über den aktuellen ApoB-Wert plus Alter hinaus beiträgt.
Stufe 2 – Validierung durch Rückrechnung
Vergleichen Sie innerhalb von Kohorten, für die verlässliche Messwerte aus der Jugend vorliegen, die rückwirkenden Schätzungen mit den gemessenen Werten, um empirische Fehlerbänder nach Altersunterschied und nach Kovariatenprofil abzuleiten. Diese Studie soll klären, ob eine retrospektive Expositionsschätzung bei Patienten, die erst nach dem 45. Lebensjahr in die Behandlung aufgenommen werden, überhaupt durchführbar ist, und sie könnte in bestehenden Kohorten mit ausreichend dichten Messwerten aus der Jugend und dem Erwachsenenalter realisierbar sein.
Stufe 3 – Anatomische Verankerung
In Kohorten mit wiederholter quantitativer Koronar-CTA – das PARADIGM-Register, ein prospektives multinationales Register von Patienten, die sich einer seriellen CCTA unterziehen, ist das eindeutigste Beispiel hierfür [49], sowie jede weitere Kohorte, einschließlich SCAPIS oder MESA müsste zunächst nachweisen, dass sich mit wiederholten quantitativen CCTA-Untersuchungen Veränderungen des Plaquevolumens messen lassen – das Plaquevolumen und das Volumen der Plaques mit geringer Dämpfung sollten in Abhängigkeit von ABY analysiert werden, um festzustellen, ob die derzeit ohne Quellenangabe kursierenden Meilenstein-Schwellenwerte eine empirische Grundlage haben. Erst dann könnten die leeren Zellen jeder veröffentlichten ApoB-Jahre-Meilensteintabelle endlich mit konkreten Zahlen gefüllt werden.
Stufe 4 – Prospektiv und interventionell
Einführung eines prospektiven Registers zur Erfassung, ob die Meldung der kumulativen ApoB-Exposition die Verschreibungspraxis der Ärzte und das Verhalten der Patienten beeinflusst Einhaltung, sowie die nachfolgende Lipidentwicklung; letztendlich ein randomisierter Vergleich zwischen einer expositionsgesteuerten und einer an Leitlinienzielen orientierten Therapie mit bildgebenden oder ereignisbezogenen Endpunkten. Nur der letzte dieser Ansätze kann belegen, dass die Messgröße die Ergebnisse tatsächlich verbessert und nicht lediglich vorhersagt.
12. Schlussfolgerung
Die Argumentation für eine kumulative ApoB-Exposition stützt sich auf vier Behauptungen, deren Aussagekraft stark variiert. Dass die Plaquebildung in hohem Maße sowohl mit dem Ausmaß als auch mit der Dauer der Exposition gegenüber apoB-haltige Partikel — wobei die Integration über die Zeit eine biologisch begründete Annäherung an diese kumulative Exposition darstellt — wird durch den Wirkmechanismus gut gestützt und steht im Einklang mit den verfügbaren Daten beim Menschen. Dass diese kumulative Exposition unabhängig von den aktuellen Lipidwerten ASCVD vorhersagt, wurde in mehreren Kohorten für LDL-C und in einer wichtigen CARDIA-Analyse für ApoB nachgewiesen. Dass das Risiko bei Diskrepanzen zwischen den beiden Werten stärker mit ApoB als mit LDL-C korreliert – bei einem Anteil der Erwachsenen, der je nach Definition, Behandlungsstatus und Methode zur LDL-C-Schätzung zwischen etwa 5% und 25% variiert und sich auf den insulinresistenten und diabetischen Phänotyp konzentriert –, wird durch alle verfügbaren Diskordanzanalysen einheitlich bestätigt. Dass ein bestimmter Wert für die kumulative Exposition als Leitlinie für eine bestimmte klinische Entscheidung dienen sollte, ist keineswegs belegt, und die Diskrepanz zwischen der dritten und der vierten Behauptung ist größer, als die Begeisterung für das Konzept vermuten lässt.
Der sinnvolle Weg besteht darin, die kumulative ApoB-Exposition als potenzielle Messgröße zu betrachten, die einer Ableitung, Kalibrierung und externen Validierung bedarf, und der Versuchung zu widerstehen, Koeffizienten zu veröffentlichen, bevor diese überhaupt vorliegen. Ein Haftungsausschluss macht eine ungültige Berechnung nicht gültig. Gleichzeitig ist der Status quo nicht neutral: Die derzeitige Praxis stützt sich zwangsläufig in erster Linie auf zeitgleiche Messungen, obwohl Atherosklerose chronisch und kumulativ verläuft, und zwar in einer Population, die zunehmend aus Patienten besteht, bei denen der LDL-C-Wert ihre Partikelbelastung unterschätzt – eine Einschränkung mit bekannter Richtung. Beide Aussagen sind wahr, und die zweite rechtfertigt keine Abkürzungen bei der ersten.
Referenzen
- Domanski MJ, Tian X, Wu CO, et al. Time Course of LDL Cholesterol Exposure and Cardiovascular Disease Event Risk. J Am Coll Cardiol. 2020;76(13):1507-1516. doi:10.1016/j.jacc.2020.07.059
- Shapiro MD, Bhatt DL. “Cholesterol-Years” for ASCVD Risk Prediction and Treatment. J Am Coll Cardiol. 2020;76(13):1517-1520. doi:10.1016/j.jacc.2020.08.004
- Zheutlin AR, Handoo F, Luebbe S, et al. Cumulative exposure to atherogenic lipoprotein particles in young adults and subsequent incident atherosclerotic cardiovascular disease. Eur Heart J. 2025;46(41):4302-4312. doi:10.1093/eurheartj/ehaf472
- Writing Committee Members, Blumenthal RS, Morris PB, et al. 2026 ACC/AHA/AACVPR/ABC/ACPM/ADA/AGS/APhA/ASPC/NLA/PCNA Guideline on the Management of Dyslipidemia: A Report of the American College of Cardiology/American Heart Association Joint Committee on Clinical Practice Guidelines. Circulation. 2026;153(17):e1154-e1276. doi:10.1161/CIR.0000000000001423
- Lower sooner: how the 2026 dyslipidemia guideline changes practice. Cardiology Magazine. American College of Cardiology; July 2026. Accessed August 10, 2026.
- Grundy SM, Stone NJ, Bailey AL, et al. 2018 AHA/ACC/AACVPR/AAPA/ABC/ACPM/ADA/AGS/APhA/ASPC/NLA/PCNA Guideline on the Management of Blood Cholesterol: A Report of the American College of Cardiology/American Heart Association Task Force on Clinical Practice Guidelines. Circulation. 2019;139(25):e1082-e1143. doi:10.1161/CIR.0000000000000625
- Williams KJ, Tabas I. The response-to-retention hypothesis of early atherogenesis. Arterioscler Thromb Vasc Biol. 1995;15(5):551-561. doi:10.1161/01.atv.15.5.551
- Tabas I, Williams KJ, Borén J. Subendothelial lipoprotein retention as the initiating process in atherosclerosis: update and therapeutic implications. Circulation. 2007;116(16):1832-1844. doi:10.1161/CIRCULATIONAHA.106.676890
- Williams KJ, Tabas I. The response-to-retention hypothesis of atherogenesis reinforced. Curr Opin Lipidol. 1998;9(5):471-474. doi:10.1097/00041433-199810000-00012
- Kumarapperuma H, Chia ZJ, Malapitan SM, Wight TN, Little PJ, Kamato D. Response to retention hypothesis as a source of targets for arterial wall-directed therapies to prevent atherosclerosis: A critical review. Atherosclerosis. 2024;397:118552. doi:10.1016/j.atherosclerosis.2024.118552
- Sniderman AD, Thanassoulis G, Glavinovic T, et al. Apolipoprotein B Particles and Cardiovascular Disease: A Narrative Review. JAMA Cardiol. 2019;4(12):1287-1295. doi:10.1001/jamacardio.2019.3780
- Rosenson RS, Hegele RA, Gotto AM Jr. Integrated Measure for Atherogenic Lipoproteins in the Modern Era: Risk Assessment Based on Apolipoprotein B. J Am Coll Cardiol. 2016;67(2):202-204. doi:10.1016/j.jacc.2015.10.059
- De Oliveira-Gomes D, Joshi PH, Peterson ED, Rohatgi A, Khera A, Navar AM. Apolipoprotein B: Bridging the Gap Between Evidence and Clinical Practice. Circulation. 2024;150(1):62-79. doi:10.1161/CIRCULATIONAHA.124.068885
- Zhang Y, Pletcher MJ, Vittinghoff E, et al. Association Between Cumulative Low-Density Lipoprotein Cholesterol Exposure During Young Adulthood and Middle Age and Risk of Cardiovascular Events. JAMA Cardiol. 2021;6(12):1406-1413. doi:10.1001/jamacardio.2021.3508
- Navar-Boggan AM, Peterson ED, D’Agostino RB Sr, Neely B, Sniderman AD, Pencina MJ. Hyperlipidemia in early adulthood increases long-term risk of coronary heart disease. Circulation. 2015;131(5):451-458. doi:10.1161/CIRCULATIONAHA.114.012477
- Wilkins JT, Ning H, Sniderman A, et al. Analysis of apoB Concentrations Across Early Adulthood and Predictors for Rates of Change Using CARDIA Study Data. J Lipid Res. 2022;63(12):100299. doi:10.1016/j.jlr.2022.100299
- Tang R, An J, Bellows BK, et al. Traditional and Emerging Lipid Markers for Cardiovascular Risk Assessment in Young vs Older Adults. JAMA Netw Open. 2026;9(4):e265199. doi:10.1001/jamanetworkopen.2026.5199
- Varvel SA, Dayspring TD, Edmonds Y, et al. Discordance between apolipoprotein B and low-density lipoprotein particle number is associated with insulin resistance in clinical practice. J Clin Lipidol. 2015;9(2):247-255. doi:10.1016/j.jacl.2014.11.005
- Johannesen CDL, Mortensen MB, Nordestgaard BG, Langsted A. Discordance analyses comparing LDL cholesterol, Non-HDL cholesterol, and apolipoprotein B for cardiovascular risk estimation. Atherosclerosis. 2025;403:119139. doi:10.1016/j.atherosclerosis.2025.119139
- Wilkins JT, Li RC, Sniderman A, Chan C, Lloyd-Jones DM. Discordance Between Apolipoprotein B and LDL-Cholesterol in Young Adults Predicts Coronary Artery Calcification: The CARDIA Study. J Am Coll Cardiol. 2016;67(2):193-201. doi:10.1016/j.jacc.2015.10.055
- Johannesen CDL, Langsted A, Nordestgaard BG, Mortensen MB. Excess Apolipoprotein B and Cardiovascular Risk in Women and Men. J Am Coll Cardiol. 2024;83(23):2262-2273. doi:10.1016/j.jacc.2024.03.423
- Sehayek D, Cole J, Björnson E, et al. ApoB, LDL-C, and non-HDL-C as markers of cardiovascular risk. J Clin Lipidol. 2025;19(4):844-859. doi:10.1016/j.jacl.2025.05.024
- Sayed A, Peterson ED, Virani SS, Sniderman AD, Navar AM. Individual Variation in the Distribution of Apolipoprotein B Levels Across the Spectrum of LDL-C or Non-HDL-C Levels. JAMA Cardiol. 2024;9(8):741-747. doi:10.1001/jamacardio.2024.1310
- Björklund P, Härdfeldt J, Äikäs L, et al. Increased transvascular retention of atherogenic lipoproteins in type 2 diabetes relates to their enhanced proteoglycan binding. JCI Insight. 2026;11(10):e177849. doi:10.1172/jci.insight.177849
- Mazidi M, Webb RJ, Lip GYH, Kengne AP, Banach M, Davies IG. Discordance between LDL-C and Apolipoprotein B Levels and Its Association with Renal Dysfunction: Insights from a Population-Based Study. J Clin Med. 2022;11(2):313. doi:10.3390/jcm11020313
- Giannakopoulou SP, Antonopoulou S, Barkas F, et al. Concordance-discordance between apolipoprotein B and lipid biomarkers in predicting 20-year atherosclerotic cardiovascular disease risk: The ATTICA study (2002-2022). Eur J Clin Invest. 2025;55(10):e70077. doi:10.1111/eci.70077
- McGill HC Jr, McMahan CA, Herderick EE, Malcom GT, Tracy RE, Strong JP. Origin of atherosclerosis in childhood and adolescence. Am J Clin Nutr. 2000;72(5 Suppl):1307S-1315S. doi:10.1093/ajcn/72.5.1307s
- McGill HC Jr, McMahan CA, Malcom GT, Oalmann MC, Strong JP. Effects of serum lipoproteins and smoking on atherosclerosis in young men and women. The PDAY Research Group. Pathobiological Determinants of Atherosclerosis in Youth. Arterioscler Thromb Vasc Biol. 1997;17(1):95-106. doi:10.1161/01.atv.17.1.95
- Berenson GS, Srinivasan SR, Bao W, Newman WP 3rd, Tracy RE, Wattigney WA. Association between multiple cardiovascular risk factors and atherosclerosis in children and young adults. The Bogalusa Heart Study. N Engl J Med. 1998;338(23):1650-1656. doi:10.1056/NEJM199806043382302
- Gidding SS, McMahan CA, McGill HC, et al. Prediction of coronary artery calcium in young adults using the Pathobiological Determinants of Atherosclerosis in Youth (PDAY) risk score: the CARDIA study. Arch Intern Med. 2006;166(21):2341-2347. doi:10.1001/archinte.166.21.2341
- Hartiala O, Magnussen CG, Kajander S, et al. Adolescence risk factors are predictive of coronary artery calcification at middle age: the cardiovascular risk in young Finns study. J Am Coll Cardiol. 2012;60(15):1364-1370. doi:10.1016/j.jacc.2012.05.045
- Steffen BT, Guan W, Remaley AT, et al. Apolipoprotein B is associated with carotid atherosclerosis progression independent of individual cholesterol measures in a 9-year prospective study of Multi-Ethnic Study of Atherosclerosis participants. J Clin Lipidol. 2017;11(5):1181-1191.e1. doi:10.1016/j.jacl.2017.07.001
- Wallenfeldt K, Bokemark L, Wikstrand J, Hulthe J, Fagerberg B. Apolipoprotein B/apolipoprotein A-I in relation to the metabolic syndrome and change in carotid artery intima-media thickness during 3 years in middle-aged men. Stroke. 2004;35(10):2248-2252. doi:10.1161/01.STR.0000140629.65145.3c
- Stone GW, Maehara A, Lansky AJ, et al. A prospective natural-history study of coronary atherosclerosis. N Engl J Med. 2011;364(3):226-235. doi:10.1056/NEJMoa1002358
- Erlinge D, Maehara A, Ben-Yehuda O, et al. Identification of vulnerable plaques and patients by intracoronary near-infrared spectroscopy and ultrasound (PROSPECT II): a prospective natural history study. Lancet. 2021;397(10278):985-995. doi:10.1016/S0140-6736(21)00249-X
- Williams MC, Kwiecinski J, Doris M, et al. Low-Attenuation Noncalcified Plaque on Coronary Computed Tomography Angiography Predicts Myocardial Infarction: Results From the Multicenter SCOT-HEART Trial (Scottish Computed Tomography of the HEART). Circulation. 2020;141(18):1452-1462. doi:10.1161/CIRCULATIONAHA.119.044720
- Tzolos E, Williams MC, McElhinney P, et al. Pericoronary Adipose Tissue Attenuation, Low-Attenuation Plaque Burden, and 5-Year Risk of Myocardial Infarction. JACC Cardiovasc Imaging. 2022;15(6):1078-1088. doi:10.1016/j.jcmg.2022.02.004
- Jia H, Abtahian F, Aguirre AD, et al. In vivo diagnosis of plaque erosion and calcified nodule in patients with acute coronary syndrome by intravascular optical coherence tomography. J Am Coll Cardiol. 2013;62(19):1748-1758. doi:10.1016/j.jacc.2013.05.071
- Nicholls SJ, Puri R, Anderson T, et al. Effect of Evolocumab on Progression of Coronary Disease in Statin-Treated Patients: The GLAGOV Randomized Clinical Trial. JAMA. 2016;316(22):2373-2384. doi:10.1001/jama.2016.16951
- Biccirè FG, Häner J, Losdat S, et al. Concomitant Coronary Atheroma Regression and Stabilization in Response to Lipid-Lowering Therapy. J Am Coll Cardiol. 2023;82(18):1737-1747. doi:10.1016/j.jacc.2023.08.019
- Nicholls SJ, Kataoka Y, Nissen SE, et al. Coronary Atheroma Regression With Evolocumab in Stable and Unstable Coronary Syndromes. JACC Cardiovasc Imaging. 2023;16(1):130-132. doi:10.1016/j.jcmg.2022.07.020
- Iatan I, Guan M, Humphries KH, Yeoh E, Mancini GBJ. Atherosclerotic Coronary Plaque Regression and Risk of Adverse Cardiovascular Events: A Systematic Review and Updated Meta-Regression Analysis. JAMA Cardiol. 2023;8(10):937-945. doi:10.1001/jamacardio.2023.2731
- Ference BA, Ginsberg HN, Graham I, et al. Low-density lipoproteins cause atherosclerotic cardiovascular disease. 1. Evidence from genetic, epidemiologic, and clinical studies. A consensus statement from the European Atherosclerosis Society Consensus Panel. Eur Heart J. 2017;38(32):2459-2472. doi:10.1093/eurheartj/ehx144
- Richardson TG, Wang Q, Sanderson E, et al. Effects of apolipoprotein B on lifespan and risks of major diseases including type 2 diabetes: a mendelian randomisation analysis using outcomes in first-degree relatives. Lancet Healthy Longev. 2021;2(6):e317-e326. doi:10.1016/S2666-7568(21)00086-6
- Wiggins BS, Barac A, Benziger CP, et al. 2026 Dyslipidemia Guideline-at-a-Glance. J Am Coll Cardiol. 2026;87(19):2617-2623. doi:10.1016/j.jacc.2026.02.4872
- Soffer DE, Marston NA, Maki KC, et al. Role of apolipoprotein B in the clinical management of cardiovascular risk in adults: An Expert Clinical Consensus from the National Lipid Association. J Clin Lipidol. 2024;18(5):e647-e663. doi:10.1016/j.jacl.2024.08.013
- Mach F, Baigent C, Catapano AL, et al. 2019 ESC/EAS Guidelines for the management of dyslipidaemias: lipid modification to reduce cardiovascular risk. Eur Heart J. 2020;41(1):111-188. doi:10.1093/eurheartj/ehz455
- Pearson GJ, Thanassoulis G, Anderson TJ, et al. 2021 Canadian Cardiovascular Society Guidelines for the Management of Dyslipidemia for the Prevention of Cardiovascular Disease in Adults. Can J Cardiol. 2021;37(8):1129-1150. doi:10.1016/j.cjca.2021.03.016
- Lee SE, Chang HJ, Rizvi A, et al. Rationale and design of the Progression of AtheRosclerotic PlAque DetermIned by Computed TomoGraphic Angiography IMaging (PARADIGM) registry: a comprehensive exploration of plaque progression and its impact on clinical outcomes from a multicenter serial coronary computed tomographic angiography study. Am Heart J. 2016;182:72-79. doi:10.1016/j.ahj.2016.09.003
- Soto-Mota A, Norwitz NG, Manubolu VS, et al. Plaque begets plaque, ApoB does not: longitudinal data from the KETO-CTA trial. JACC Adv. 2025;4(7):101686. doi:10.1016/j.jacadv.2025.101686. [Retracted]
- Expression of Concern: “Plaque Begets Plaque. ApoB Does Not: Longitudinal Data from The KETO-CTA Trial” [JACC: Advances, Volume 4, Issue 7, July 2025, Article 101686]. JACC Adv. 2026;5(3):102607. doi:10.1016/j.jacadv.2026.102607
- Kaplan H, Thompson RC, Trumble BC, et al. Coronary atherosclerosis in indigenous South American Tsimane: a cross-sectional cohort study. Lancet. 2017;389(10080):1730-1739. doi:10.1016/S0140-6736(17)30752-3
Offenlegung und Status. Dies ist ein Narrativer Review und Forschungsrahmen. Darin wird die kumulative ApoB-Exposition als deskriptives Maß definiert und ausdrücklich darauf hingewiesen, dass es sich dabei noch nicht um eine validierte individuelle Risikokennzahl handelt; es wird kein Schwellenwert für die kumulative Exposition empfohlen und es wird kein individueller Risikowert angegeben. Referenz [23] stützt sich auf die online veröffentlichte Fassung des zitierten Artikels aus „JAMA Cardiology“; die Seitenangaben beziehen sich auf die gedruckte Ausgabe. Klinische Entscheidungen sollten sich an den aktuellen Leitlinienempfehlungen orientieren.