
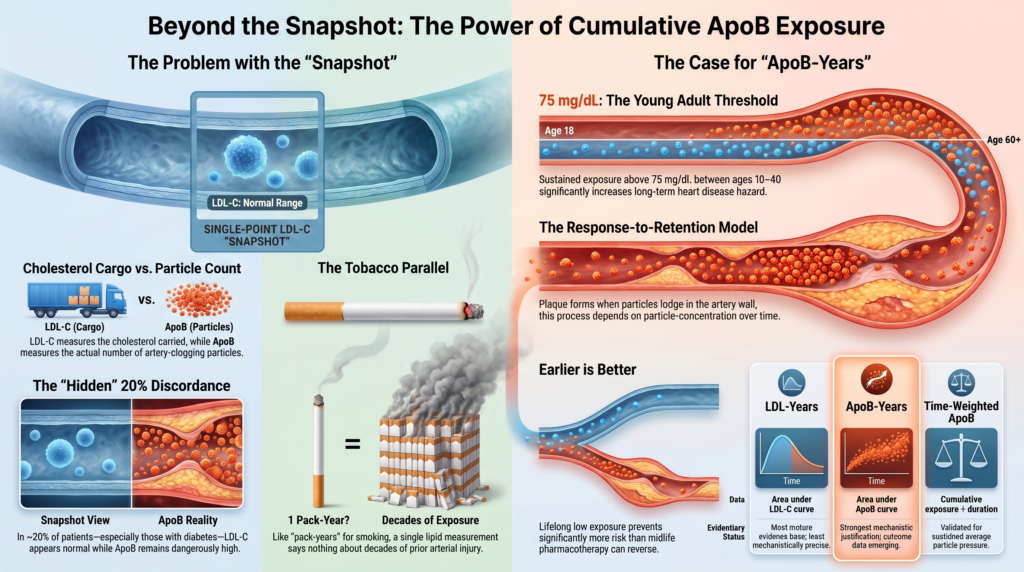
Hoe hoger ApoB, hoe langer de blootstelling, hoe slechter het is
Cumulatief Apolipoproteïne B-belichting
Biologische Rationale, Menselijk Bewijs, Meetuitdagingen en een Voorgesteld Onderzoekskader
Abstract
atherosclerotisch hart- en vaatziekten (ASCVD) is een ziekte van cumulatieve blootstelling, toch wordt het nog bijna uitsluitend beoordeeld met cross-sectionele lipidemetingen. Een belangrijke causale determinant van tandplak is het aantal apolipoproteïne B (apoB)-houdend lipoproteïne deeltjes die de endotheel en worden vastgehouden in de slagader intima, geïntegreerd in de tijd. Dat construct — apoB-jaren — is mechanistisch gezien betrouwbaarder dan welke afzonderlijke apoB-waarde dan ook en betrouwbaarder dan LDL-cholesterol (LDL-C) op elk willekeurig moment, omdat LDL-C meet cholesterol lading in plaats van deeltjesaantal.
Deze overzichtsstudie synthetiseert vier samenvlopende lijnen van menselijk bewijs: (1) longitudinale cohortgegevens die aantonen dat cumulatieve blootstelling aan LDL-C en cumulatieve apoB incidentele ASCVD voorspellen, onafhankelijk van gelijktijdige lipidewaarden; (2) discordantie analyses waaruit blijkt dat waar apoB en LDL-C van elkaar verschillen, het risico beter overeenkomt met apoB, waarbij de prevalentie en omvang van dat verschil sterk afhangen van de populatie, het lipidenfenotype, de behandelstatus en de methode voor LDL-C-schatting; (3) beeldvormings- en pathologiegegevens die cumulatieve blootstelling koppelen aan plaquebelasting terwijl plaquebelasting wordt onderscheiden van risico op voorvallen; en (4) interventiegegevens die aantonen dat intensieve verlaging van atherogene lipoproteïnen, voornamelijk aangetoond door middel van LDL-C-verlagende interventies, kransslagaders tot stilstand brengt en gedeeltelijk omkeert atheroom langs een dosis-effectrelatie curve waarin binnen het bestudeerde bereik geen duidelijke ondergrens is vastgesteld.
Op die basis definiëren we cumulatieve apoB-blootstelling als een beschrijvende onderzoeksmaatstaf, uitgedrukt in mg/dL·jaar, en leggen we expliciet uit waarom deze momenteel niet kan worden omgezet in een individuele risicoschatting. Drie beperkingen zijn doorslaggevend and worden achtereenvolgens onderzocht: de gepubliceerde cumulatieve blootstelling risicoverhoudingen werden afgeleid van op splines gebaseerde gemengde modellen over een gedefinieerd leeftijdskenvenster en beschrijven een cohort-relatieve associatie, geen individuele vermenigvuldiger; een populatiegemiddelde apoB-helling kan het vroege-levensstraject van een individu niet reconstrueren; en associaties op trial-niveau tussen plaqueverandering en gebeurtenisreductie kunnen niet worden overgedragen op individuele patiënten. We behandelen apoB-jaren des overeenkomstig — als een kandidaatmetriek die afleiding, kalibratie en externe validatie vereist — en sluiten af met het validatieprogramma dat vereist zou zijn voordat het de zorg kan informeren.
1. Het probleem met de snapshot
Hedendaags lipidenbeheer vraagt van een chronisch zieke slagader een enkele vraag op een enkel moment. Aan een 52-jarige die zich presenteert met een LDL-C van 118 mg/dL worden een risicocategorie, een behandelingsdrempel en een vervolginterval toegewezen op basis van een meting die de dag van vandaag beschrijft. Die zegt niets over de vraag of die persoon dertig jaar lang een LDL-C van 75 mg/dL heeft gehad en de laatste drie is gestegen, of vanaf de adolescentie 160 mg/dL heeft gehad en nu pas begint te dalen. Die twee slagaders bevinden zich niet in dezelfde conditie, en geen enkele hoeveelheid statistische aanpassing op de huidige waarde compenseert dat verschil.
De vergelijking met blootstelling aan tabak is conceptueel nuttig, hoewel biologisch imperfect: pakjaren is zelf een onvolmaakte index die de inademingsdiepte, de timing van het stoppen of niet-lineaire effecten niet weergeeft, en de apoB-blootstelling werkt eveneens wisselwerking in de hand met arteriële gevoeligheid en andere risicofactoren. Toch is de onderliggende logica vergelijkbaar. Een enkele meting van het aantal vandaag gerookte sigaretten is vrijwel niet-informatief; pack-years is de variabele die prognostische waarde heeft. Cumulatieve blootstelling aan lipoproteïnen — “cholesteroljaren,” “LDL-jaren,” of, mechanistisch gezien, directer weergegeven als “apoB-jaren” — is het cardiovasculaire analoog [1], [2], [3].
Drie ontwikkelingen maken dit het juiste moment om de maatstaf te formaliseren. Ten eerste zijn er nu directe longitudinale gegevens over cumulatieve apoB-blootstelling, en niet alleen cumulatieve LDL-C [3]. Ten tweede zijn apoB-tests gestandaardiseerd, niet-nuchter en over het algemeen goedkoop in veel zorgsystemen, en de multisociety-richtlijn van de ACC/AHA uit 2026 dyslipidemie de richtlijn breidt de selectieve apoB-meting uit en integreert deze prominenter in de routinematige beoordeling, voortbouwend op de beperktere risicoversterkende rol die al werd erkend in de richtlijn van 2018, waarin apoB van 130 mg/dL of hoger werd benoemd als een risicoversterkende factor en triglyceriden op of boven 200 mg/dL een relatieve indicatie om het te meten4], [5], [6Ten derde komt de populatie waarin LDL-C misleidt — het insulineresistente en diabetische fenotypen met cholesterol-gedepleteerde deeltjes en triglyceride-rijke remnanten — veel voor en groeit deze in hedendaagse primaire-preventiepopulaties.
2. Waarom deeltijd, niet cholesterol-nu, de geprefereerde blootstellingsvariabele is
2.1 Respons-naar-retentie als een massawerkingsproces
atherogenese begint wanneer apoB-bevattende lipoproteïnen de endotheliale barrière passeren en in de subendotheliale matrix worden vastgehouden door ionische interactie tussen de basische residugroepen op apoB-100 en de negatief geladen gesulfateerde glycosaminoglycaan ketens van intimale proteoglycanen versican, biglycaan, decorine [7], [8]. Behoud gaat vooraf ontsteking. Het gaat vooraf aan de rekrutering van monocyten, schuimcel vorming, en elke cellulaire gebeurtenis die daarop volgt. Dit is de respons-op-retentie-hypothese, wat binnen een paar jaar na de formulering ervan werd versterkt [9en blijft de dominante mechanistische beschrijving van vroege atherogenese in hedendaagse overzichten10].
Het kinetische gevolg is klinisch gezien het punt dat er toe doet. Als de massa van de plaque afhangt van het aantal vastgehouden deeltjes, en retentie afhangt van het aantal deeltjes dat per tijdseenheid aan het endotheel wordt aangeboden, dan gedraagt de ophoping van plaque zich als een integraal in plaats van als een momentopname. transcytose van apoB-deeltjes is receptor-gemedieerd — scavenger-receptor klasse B lid 1 (SR-B1) en activine-receptorachtige kinase 1 (ALK1) zijn beide implicaties toegeschreven — en is concentratieafhankelijk [10].
De sterkte van die afhankelijkheid moet niet worden overdreven. Het is directioneel concentratieafhankelijk, geen exacte één-op-één wet bij de mens. kransslagaders: binnendringen en retentie worden gewijzigd door endotheelpermeabiliteit, arteriële segmentgeometrie en hemodynamiek, deeltjesgrootte en samenstelling, proteoglycaanbinding affiniteit, bloeddruk, glycemische status, klaring uit de intima en de bestaande plaque-architectuur. De verdedigbare stelling is dat een hoger circulerend apoB-concentratie het aantal deeltjes vergroot dat beschikbaar is voor arteriële binnendringing en retentie, en dat dit, geïntegreerd in de tijd, de cumulatieve ingehouden belasting vergroot, waarbij de individuele relatie wordt gemodificeerd door de vatbaarheid van de arteriële wand.
2.2 Waarom apoB de atherogene deeltjesbelasting directer weergeeft dan LDL-C
Elk vanuit de lever afkomstig VLDL, IDL, LDL, en Lp(a)-deeltjes bevatten één molecuul apoB-100, en routinematige totale apoB-bepalingen kunnen daarnaast ook detecteren apoB-48 op deeltjes die afkomstig zijn uit de darmen. Vanwege die nagenoeg één-op-één relatie biedt plasma-apoB een gestandaardiseerde schatting die evenredig is met de totale concentratie van atherogene deeltjes. Het is hier de moeite waard om precies te zijn: routinematige tests rapporteren apoB als een massaconcentratie in mg/dL, en niet als een molaire deeltjeshoeveelheid in nmol/L, en apoB-48 van darmdeeltjes, verschillen in moleculaire massa van apoB en testkalibratie introduceren allemaal een marge tussen de gemeten massa en het ware deeltjesaantal. ApoB is een gestandaardiseerde volmacht voor deeltjesbelasting, niet letterlijk een telling. LDL-C daarentegen meet de cholesterol die in LDL-deeltjes wordt meegevoerd, wat een variabele hoeveelheid is: deeltjes hebben minder cholesterol in insulineresistentie, hypertriglyceridemie en type 2 diabetes, en verrijkt met cholesterol in andere staten [11], [12].
Dit leidt tot een systematisch en voorspelbaar faalscenario. Twee patiënten met een identiek LDL-C kunnen aanzienlijk verschillende deeltjesaantallen hebben, en degene met meer deeltjes heeft meer objecten die de slagaderwand kunnen binnendringen en zich daarin vastzetten. Het cholesterolgehalte van de deeltjes geeft niet direct de hoeveelheid deeltjes aan die beschikbaar is voor arteriële binnendringing en retentie, hoewel de samenstelling en grootte van de deeltjes hun arteriële gedrag kunnen beïnvloeden. Cumulatieve apoB-blootstelling heeft daarom de meest directe mechanistische overeenkomst met atherogene deeltjesblootstelling; cumulatieve LDL-C-blootstelling is hiervan een proxy die toevallig een langere epidemiologische geschiedenis heeft omdat LDL-C vaker werd gemeten in de cohorten die het langst liepen.
Deze asymmetrie — een beter construct, dunnere directe data — is de eerlijke staat van het veld en moet duidelijk worden vermeld in elk klinisch voorstel dat daarop is gebouwd.
2.3 De blootstellingsmetriek, gerangschikt
| Metrisch | Definitie | Wat het vastlegt | Bewijswaarde |
| Huidige apoB | Enkel gemeten deeltjesconcentratie | Alleen de huidige deeltjesbelasting | Goed gevalideerd als een cross-sectionele risicomarker; het risico volgt over het algemeen apoB wanneer apoB en LDL-C discordant zijn, hoewel de incrementele verbetering ten opzichte van nauwkeurig geschat LDL-C of niet-HDL-C varieert per populatie [13] |
| Tijdsgewogen gemiddelde apoB | Cumulatieve blootstelling ÷ duur | Aanhoudende gemiddelde deeltjesdruk, normaliserende fluctuatie | Cumulatieve/tijd-geïntegreerde blootstelling gevalideerd voor LDL-C; direct apoB-bewijs in opkomst3], [14] |
| LDL-jaren | Oppervlakte onder de LDL-C-versus-leeftijd-curve | Cumulatieve cholesterolbelading afgeleverd aan de vaatwand | Meest volwassen longitudinale bewijsbasis; onafhankelijk van LDL-C op middelbare leeftijd [1], [14] |
| Non-HDL-jaren | Gebied onder de non-HDL-C-versus-leeftijdscurve | Alle cholesterol in apoB-deeltjes, inclusief remnants | Gevalideerd in jongvolwassenenstudies naar cumulatieve blootstelling aan verhoogd niet-HDL-C [15]; er is geen direct vergelijkend voordeel ten opzichte van LDL-jaren aangetoond |
| ApoB-jaren | Gebied onder de apoB-versus-leeftijdscurve | Geïntegreerde deeltjestijd — directe proxy voor subendotheliale insluiting | Meest directe mechanistische correspondentie met atherogene deeltjesblootstelling; directe humane uitkomstdata in ontwikkeling3]. Niet gevalideerd als klinische meting. |
Tabel 1. Cumulatieve lipoproteïne-blootstellingsmetingen. De voorgestelde ordening naar mechanistische proximiteit plaatst apoB-jaren bovenaan, terwijl LDL-jaren momenteel de diepste longitudinale validatie heeft. Elk klinisch instrument moet eerlijk zijn over die omkering.
3. Het menselijk bewijs voor cumulatieve blootstelling
3.1 Cumulatieve LDL-C-blootstelling: de volwassen bewijsbasis
Domanski en collega's analyseerden 4.958 CARDIA deelnemers ingeschreven op de leeftijd van 18 tot 30 jaar en gedurende een mediaan van 16 jaar na de leeftijd van 40 jaar gevolgd. Zowel de oppervlakte onder de LDL-C-versus-leeftijdscurve als het tijdsverloop van de accumulatie ervan voorspelden onafhankelijk van elkaar incidente cardiovasculaire events na correctie voor geslacht, ras en traditionele risicofactoren: hazard ratio 1,053 per 100 mg/dL·jaar cumulatieve blootstelling (p < 0,0001), en hazard ratio 0,797 per mg/dL/jaar helling (p = 0,045) [1]. De tweede coëfficiënt is de meest interessante. Een negatief hellingsverband betekent dat dezelfde totale blootstelling die later in het leven werd opgedaan, geassocieerd was met een lager later risico dan dezelfde totale hoeveelheid die eerder werd opgedaan. Tijd is niet enkel een vermenigvuldiger van de concentratie; het moment in het leven waarop de blootstelling plaatsvindt, wijzigt het risico onafhankelijk.
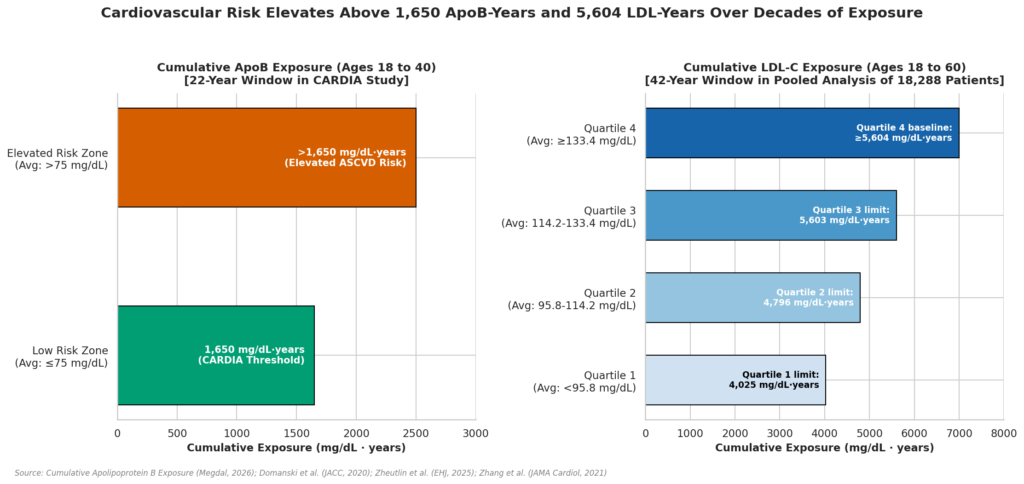
Zhang en collega's breidden dit uit in een gepoolde analyse van 18.288 deelnemers uit vier Amerikaanse cohorten, waaruit bleek dat de cumulatieve LDL-C-blootstelling van 18 tot 60 jaar het optreden voorspelde van kransslagaderziekte onaf kwartielen die ongeveer <4.025, 4.025–4.796, 4.797–5.603 en ≥5.604 mg/dL·jaar [14]. Navar-Boggan en collega's toonden aan in de Framingham Offspring-cohort dat elk decennium van blootstelling aan hyperlipidemie in de jonge volwassenheid gepaard ging met een gecorrigeerde hazardratio van 1,39 voor coronaire hartziekte na correctie voor niet-HDL-cholesterol op de leeftijd van 55 jaar, en dat 85% van de jonge volwassenen met langdurige hyperlipidemie niet zouden hebben voldaan aan statine criteria op 40-jarige leeftijd onder de destijds geldende richtlijnen15].
Dat laatste cijfer illustreert een belangrijke beperking van de huidige op drempelwaarden gebaseerde benaderingen. Een cumulatieve blootstellingsmetriek lijkt beter geschikt voor het identificeren van personen die arteriële schade oplopen en desondanks onder de conventionele behandelingsdrempels blijven — precies de groep die een huidige drempelwaarde met een enkele waarde structureel niet kan signaleren.
| Hoe deze blootstellingen daadwerkelijk werden berekend — een beperking voor alles wat erop volgt
Domanski en collega's somden de gemeten waarden niet op. Zij vertegenwoordigden bezoeken naar leeftijd en pasten een niet-parametrisch op cubische splines gebaseerd gemengd model toe om het LDL-C per proefpersoon te schatten van leeftijd 18 tot 40, waarbij informatie over het hele cohort werd geleend. De CARDIA apoB-analyse gebruikte een analoog spline gemengd model met de best lineaire onbevooroordeelde voorspelling [1], [3]. Het observatievenster betrof de leeftijden 18 tot 40; het voorspellingsvenster betrof de leeftijden 40 tot 66. De hazardratio van 1,053 per 100 mg/dL·jaar beschrijft de blootstelling opgedaan in het eerste venster die gebeurtenissen in het tweede voorspelt. Elk schema dat een enkele waarde terugrekent, lineair interpoleert en trapezofisch integreert uit schaarse klinische panels, is een ongev valideerde benadering van die methode — geen implementatie ervan — en elke coëfficiënt die buiten het inclusievenvenster van 18 tot 40 wordt toegepast, wordt gebruikt buiten de omstandigheden waarin deze is geschat. |
3.2 Cumulatieve apoB-blootstelling: het directe bewijs
De belangrijkste afzonderlijke studie hier analyseerde 4.366 CARDIA-deelnemers met door NMR verkregen apoB-concentraties, LDL-deeltjesaantal (LDL-P) en het aantal triglyceriderijke lipoproteïnedeeltjes (TRL-P) gedurende een blootstellingsvenster van 22 jaar van 18 tot onder de 40 jaar, met 241 ASCVD-gebeurtenissen gedurende een gemiddelde vervolgduur van 19,3 jaar [3]. Elke toename van de cumulatieve apoB-blootstelling met 1 standaardafwijking ging gepaard met een niet-gecorrigeerde hazardratio van 1,53 (95%-BI 1,36–1,72); na correctie voor covariabelen bedroeg de hazardratio ongeveer 1,30. De cumulatieve LDL-P- en TRL-P-waarden vertoonden vrijwel hetzelfde patroon (niet-gecorrigeerde HR’s 1,54 en 1,48).
Belangrijk is dat de auteurs een omslagpunt identificeerden: het ASCVD-risico begon te stijgen boven een gebruikelijke apoB-blootstelling van ongeveer 75 mg/dL die gedurende de leeftijden van 18 tot onder de 40 jaar werd gehandhaafd. Zij stelden apoB onder 75 mg/dL voor als een doel om een laag risico bij jongvolwassenen te behouden. Uitgedrukt als een integraal over dat venster van 22 jaar, komt 75 mg/dL overeen met een rekenkundig equivalent van ongeveer 1.650 mg/dL·jaar (75 × 22) — een transformatie van het gerapporteerde referentieniveau, geen afzonderlijk afgeleid afkappunt.
| Wat dat cijfer van 1.650 wel en niet is
Het is: een cohortspecifiek, uit splines afgeleid referentiepunt rond 75 mg/dL, waarboven het geschatte risico op een gebeurtenis duidelijker verhoogd raakte over één specifiek leeftijdsvenster, gebruikmakend van door NMR verkregen apoB. Het is NIET: een gevalideerde drempelwaarde voor het verschijnen van de eerste plaque, voor verkalking, voor hoogrisicoplaque-morfologie, of voor eerste myocardinfarct. Het is NIET: overdraagbaar zonder aanname naar immuunassay apoB, naar andere leeftijdscategorieën, of naar populaties met andere risicofactorprofielen. Om dit getal te presenteren als een klinisch afkappunt zonder die inkadering zou een overschatting zijn. |
Trajectveranderlijkheid is aanzienlijk en moet worden gemodelleerd, niet worden weggeredeneerd. Bij 3.055 CARDIA-deelnemers die over een periode van 30 jaar op vijf onderzoeken zijn gemeten, was de gemiddelde geannualiseerde verandering van apoB 0,52 mg/dL/jaar (SD 1,0), maar individuele snelheden varieerden van -6,26 tot +9,21 mg/dL/jaar [16]. Een enkelvoudige extrapolatie naar het verleden vanuit een waarde op middelbare leeftijd is daarom een benadering met een grote foutenmarge, en elk instrument dat daarop is gebouwd, moet die onzekerheid tonen in plaats van deze achter een puntschatting te verbergen.
3.3 Voorspelling bij jongvolwassenen in het bijzonder
In een samengevoegde analyse van 10.519 volwassenen uit Amerikaanse op de gemeenschap gebaseerde cohorten was apoB sterker geassocieerd met ASCVD bij volwassenen van 18 tot 39 jaar dan bij degenen van 40 jaar of ouder, en het toevoegen van apoB aan de PREVENT-vergelijkingen verbeterd risico herclassificatie in de jongere groep (continue NRI 0,67, 95%-betrouwbaarheidsinterval 0,23–1,09, voor het 10-jaarsrisico en 0,47, 95%-betrouwbaarheidsinterval 0,02–0,84, voor het 30-jaarsrisico), maar niet in de oudere groep [17De auteurs waren terecht voorzichtig dat deze verbeteringen bescheiden waren. Niettemin is het directionele signaal consistent: hoe jonger de patiënt, hoe meer de enkele meting het levenslange probleem onderdrukt, en hoe sterker de rationale is om te testen of een cumulatieve benadering voorspellende informatie toevoegt.
4. Discordantie: Het sterkste praktische argument voor apoB
4.1 Hoeveel onenigheid eigenlijk
Discordantie is de situatie waarin apoB en LDL-C een patiënt in verschillende risicocategorieën indelen. Omdat de twee bij de meeste patiënten sterk gecorreleerd zijn, kan conventionele regressie hun voorspellende bijdragen niet helder van elkaar scheiden; in een groot cohort uit de klinische praktijk waren apoB en via NMR gemeten LDL-deeltjesaantal zelf sterk gecorreleerd (R² = 0,79) [18Discordantie-analyse is het methodologische antwoord, en dat is er in drie varianten: discordantie volgens klinische afkappunten, volgens populatiepercentielen en volgens regressieresiduen.19].
De schattingen van de prevalentie liggen binnen een aannemelijk bereik, en het werkcijfer van ongeveer 20% is redelijk als een schatting in het bovenste deel van het middenbereik voor risicogroepen, hoewel dit beter als een bereik kan worden weergegeven in plaats van als een exacte waarde.
| Bron | Bevolking en definitie | Schatting van discordantie |
| De Oliveira-Gomes et al., Circulation 2024 [13] | Beoordeling tussen cohorten; discordant hoog apoB volgens verschillende definities | 5,31 TP9T tot 24,91 TP9T, afhankelijk van de definitie en de populatie |
| CARDIA apoB-trajectanalyse, J Lipid Res 202216] | Hoger of lager dan gemiddeld apoB voor een gegeven non-HDL-C | Ongeveer 8% tot 20% |
| CARDIA jongvolwassene discord discordantie vs. CAC20] | apoB op gemiddelde leeftijd van 25 jaar voorspelt latere CAC beter dan LDL-C of niet-HDL-C | 18% jongvolwassenen |
| Health Diagnostic Laboratory-cohort, n = 412.013 [18] | apoB vs. NMR LDL-P volgens klinische afkappunten | 5%–6% wordt uitsluitend door LDL-P gemarkeerd; 6%–7% uitsluitend door apoB |
| Kopenhagen Algemene Bevolkingsstudie, n = 95.108 [21] | Overtollige apoB (gemeten minus LDL-C-voorspeld) ≥11 mg/dL | Gegradueerde strata over het volledige LDL-C-spectrum |
Tabel 2. Gerapporteerde prevalentie van klinisch relevante apoB/LDL-C-discordantie. De spreiding weerspiegelt echte methodologische heterogeniteit in hoe discordantie wordt gedefinieerd, en geen meningsverschil over de vraag of deze bestaat.
4.2 Wint apoB wanneer ze het oneens zijn?
A systematische literatuurstudie van gepubliceerde discordantie-analyses met 15 studies en 593.354 deelnemers, uiteenlopende populaties, behandeld en onbehandeld, waarbij gebruik werd gemaakt van op mediaan, percentiel, residu en variantie gebaseerde definities. ApoB presteerde beter dan LDL-C in 9 van de 9 vergelijkingen. ApoB presteerde beter dan niet-HDL-C in 7 van de 9, gelijkspel in 1, en verloor in 1. Het aantal LDL-deeltjes presteerde beter dan LDL-C in 2 van de 3 [22]. Dat is ongeveer net zo eenrichtingsverkeer als de preventieve cardiologie produceert.
De Copenhagen General Population Study operationaliseerde discordantie als “overtollige apoB” — gemeten apoB minus de apoB voorspeld op basis van alleen LDL-C, waarbij de voorspelling werd afgeleid van individuen met triglyceriden ≤1 mmol/L. Onder 53.484 vrouwen en 41.624 mannen die geen statines gebruikten, met een mediane follow-up van 9,6 jaar met 2.048 myocardinfarcten en 4.282 ASCVD-gebeurtenissen, was overtollige apoB dosis-afhankelijk geassocieerd met het risico over het hele LDL-C-spectrum [21]. De risicoverhoudingen van die analyse zijn overgenomen in Tabel 3, aangezien deze het empirische anker vormen voor de discussie over discordantie in Sectie 8.
| Overtollige apoB (mg/dL) | ASCVD-risico, vrouwen | ASCVD-risico, mannen | Interpretatie |
| <11 (referentie) | 1.00 | 1.00 | Concordant |
| 11–25 | 1.08 (0.97–1.21) | 1.14 (1.02–1.26) | Milde discordantie |
| 26–45 | 1.30 (1.14–1.48) | 1.41 (1.26–1.57) | Matige discordantie |
| 46–100 | 1.34 (1.14–1.58) | 1.41 (1.25–1.60) | Uitgesproken discordantie |
| >100 | 1.75 (1.08–2.83) | 1.52 (1.13–2.05) | Ernstige discrepantie |
Tabel 3. Multivariabel-gecorrigeerde ASCVD-hazard ratios naar excessieve apoB-stratum, Copenhagen General Population Study [21]. Results were robust across the entire LDL-C spectrum.
4.3 The insulin-resistant and diabetic phenotype
Discordance is not randomly distributed. It concentrates, predictably and mechanistically, in a metabolic phenotype that is common in contemporary primary-prevention populations.
In insuline resistance and type 2 diabetes, hepatic VLDL overproduction and impaired lipolysis generate a triglyceride-rich pool. Cholesteryl ester overdragen eiwit exchanges triglyceride into LDL and HDL in return for cholesteryl ester; hepatic lipase then hydrolyzes the triglyceride-enriched LDL, yielding small, dense, cholesterol-depleted LDL particles. The result is a high particle number carrying a normal or even low cholesterol mass. LDL-C reads reassuringly. ApoB does not [11], [12].
Distribution data make the magnitude concrete. In a nationally representative NHANES sample of statin-naive US adults, at an LDL-C of 100 mg/dL half the population had an apoB between 75 and 86 mg/dL (the interquartile range), and an LDL-C of 70 mg/dL corresponded to a median apoB of about 60 mg/dL [23]. Greater positive discordance — higher measured than expected apoB — was associated with older age, male sex, obesitas, diabetes, higher triglycerides, higher HbA1c, statin use, and poor metabolische gezondheid. Notably, variability within these subgroups exceeded the between-group differences, which is an argument for measuring apoB rather than for inferring it from phenotype.
The mechanism extends past particle count into retention kinetics. Insulin resistance stimulates vascular smooth muscle synthesis of proteoglycans with hyperelongated glycosaminoglycan chains, increasing the density of negative charge in the intimal matrix and its avidity for apoB [8]. Direct measurement supports enhanced retention: the interstitial-fluid-to-serum ratio of apoB is significantly lower in type 2 diabetes than in controls, consistent with greater subendothelial entrapment rather than lymphatic clearance [24]. These findings support the possibility that diabetes raises risk through both a greater particle burden per unit of cholesterol and arterial-wall changes that may favour retention once particles arrive.
Discordantly high apoB is also independently associated with prevalent chronische nierziekte in cross-sectional data. In 13,767 NHANES participants, those with low LDL-C and high apoB had the strongest association with prevalent CKD (OR 1.12, 95% CI 1.08–1.16) relative to the concordant-low group, alongside the highest fasting glucose, insulin, and HOMA-IR values [25].
4.4 The strongest counterargument, stated fairly
The 2026 multisociety guideline makes a methodological point that any advocate of apoB must confront directly: when LDL-C is estimated with the Martin/Hopkins equation rather than the Friedewald formula, the measured prevalence of LDL-C/apoB discordance falls markedly [4]. A meaningful share of measured historical discordance was attributable to a 1972 estimating equation that assumes a fixed triglyceride-to-VLDL-cholesterol ratio of 5:1 — an assumption that fails precisely in the hypertriglyceridemic, insulin-resistant patients where discordance was reported to be greatest.
This does not dissolve the case for apoB, but it does resize it. The honest position is that part of the historical discordance signal reflected LDL-C estimation method rather than particle biology, while part reflects genuine biological discordance, and that the residual real discordance is smaller than the older literature implies. The direct measurement argument survives intact: apoB requires no estimating equation, is unaffected by fasting status, and is analytically standardized. A second counterargument deserves the same candor — the ATTICA cohort found that elevated apoB independently predicted 20-year ASCVD risk, but principally in the presence of concomitantly elevated LDL-C, which tempers the claim that apoB routinely rescues risk that LDL-C misses entirely [26].
5. From Exposure to Plaque
The link from cumulative exposure to anatomical disease rests on autopsy pathology, longitudinal imaging cohorts, and intervention trials.
De PDAY (Pathobiological Determinants of Aderverkalking in Youth) investigators established that atherosclerosis begins in childhood and that conventional risk-factor scores correlate with the earliest anatomically demonstrable laesies in people aged 15 to 34, not merely with advanced disease [27]. In the primary PDAY autopsy series of 1,079 men and 364 women aged 15 through 34 who died of external causes, the extent of intimal surface involved by vetstrepen and raised lesions in the aorta and right coronary artery rose with age, was positively associated with VLDL-plus-LDL cholesterol concentration, and was negatively associated with HDL cholesterol [28]. De Bogalusa Heart Study showed that the extent of aortic and coronary fatty streaks and fibrous plaques rose with the number of risk factors present, including LDL-related measures [29]. These are the observations that make a lifetime-exposure framing biologically well supported rather than merely elegant.
Longitudinal imaging bridges youth exposure to midlife anatomy. In CARDIA, PDAY risk scores measured in young adulthood predicted coronary and abdominal aortic calcium two decades later [30]. In the Cardiovascular Risk in Young Finns cohort, adolescent risk-factor exposure predicted coronary artery calcium in adulthood [31]. Neither study computed apoB-years, but both are consistent with cumulative burden as the operative variable.
ApoB-specific plaque associations exist. In MESA, over a median 9.4 years, top-quartile apoB was associated with carotid plaque progression after adjustment for LDL-C or for total and HDL cholesterol, though the association lost significance when all lipid covariates were included together (p = 0.086) — a signal, not an independent one [32]. In the Atherosclerosis and Insulin Resistance (AIR) study, a high apoB/apoA-I ratio was associated with a greater three-year progression rate of carotid intima-mediadikte in clinically healthy 58-year-old men [33].
| The gap that must be acknowledged
There is no validated apoB-years threshold for: first detectable plaque, early fibroatheroom, positieve remodelering, onset of calcification, high-risk plaque morphology, or first myocardial infarction. Published tables assigning specific apoB-year or LDL-year values to these milestones circulate widely in secondary and online sources. Those figures do not trace to primary peer-reviewed derivations and should not be reproduced in a clinical instrument. The defensible position is that each individual has, in effect, a personal plaque threshold — cumulative exposure interacts with inherited arterial susceptibility, blood pressure, glycemia, roken, renal function, inflammation, and Lp(a), so the exposure at which plaque appears varies substantially between individuals. |
6. Plaque Burden Is the Substrate; Events Require a Trigger
Conflating plaque burden with event risk is a common conceptual error, and any proposed metric must keep the distinction explicit. Plaque accumulation is a graded, concentration-dependent process, though a heterogeneous and probabilistic one: two people with the same cumulative exposure may accumulate substantially different plaque depending on blood pressure, smoking, glycemia, genetica, Lp(a), arterial geometry, inflammation, and local endothelial biology. Acute events are threshold-crossing phenomena requiring a vulnerable lesion, a mechanical or inflammatory trigger, and a thrombogenic milieu.
PROSPECT demonstrated that future events frequently arose from lesions that were angiographically mild at baseline — mean diameter stenosis around 32% — but which carried large plaque burden, small luminal area, or dunnekapfibroatheroom morphology on intravascular imaging [34]. PROSPECT II showed that lipiderijke plaques with large plaque burden independently predicted nonculprit-lesion events: patients harbouring at least one lesion with both a large plaque burden and a large lipidenkern had a four-year nonculprit-lesion-related MACE rate of 13.2%, while the corresponding lesion-level rate was 7.0% [35]. That distinction matters, and the figure cuts both ways: it is clinically meaningful, and it also means the great majority of high-risk lesions did not cause an event over four years.
On CT angiography, SCOT-HEART established laag-attenuatie plaque burden as the strongest predictor of subsequent myocardial infarction, adding value beyond calciumscore and obstructive stenose [36]. In a later SCOT-HEART analysis, low-attenuation plaque burden above 4% carried a hazard ratio of 4.87 for fatal or nonfatal MI and pericoronary adipose tissue attenuation a hazard ratio of 2.45, with the two combined identifying the highest-risk group and raising the area under the curve from 0.71 for low-attenuation plaque alone to 0.75 for the combination [37]. Acute coronary syndromes arise variously from plaqueruptuur, plaque erosion, and calcified nodules; erosion in particular may occur with modest plaque burden and near-normal angiographic appearance, but still on an atherosclerotic substrate [38].
Two corrections to how this is often summarized are worth making. First, the relation is best stated as a heuristic rather than a model: plaque burden defines the anatomical substrate and strongly constrains event probability, while lesion phenotype, local biomechanical stress, systemic inflammation, and thrombogenicity influence whether and when an acute event occurs. Writing it as a product of three terms is a useful diagram, not an established quantitative relationship, and it should not be presented as one.
Second, emphasizing vulnerability can understate how powerfully total plaque burden itself predicts events. Modern imaging data place total burden among the strongest available predictors, and the reason is straightforward arithmetic: the more plaque a person carries, the more lesions exist that could rupture or erode, the greater the probability that at least one has adverse morphology, the larger the inflamed and thrombogenic arterial surface, and the higher the likelihood of obstructive progression. The chain is best written as cumulative apoB exposure → plaque burden and plaquefenotype → number and phenotype of lesions → probability of an event. This chain is a causal framework rather than a validated quantitative mediation model. Cumulative exposure relates strongly to lifetime event risk; it is far less able to say which plaque will produce an event next year.
7. Regression: Can Cumulative Exposure Be Repaid?
The clinical appeal of an exposure metric depends partly on whether reducing forward accrual does anything to existing disease. The intravascular imaging trials answer this affirmatively, with an important correction to a claim that appears frequently in secondary sources.
Glagov randomized 968 patients with symptomatic coronary disease to evolocumab of placebo on background statin therapy. Mean achieved LDL-C in the evolocumab arm was 36.6 mg/dL, and atheroompercentage op basis van volume changed by −0.95% versus no significant change on statin plus placebo [39]. That −0.95% is a treatment-group mean, with substantial individual heterogeneity; it does not mean every participant regressed. PACMAN-AMI added alirocumab naar krachtig statine after acute myocardial infarction and, using serial IVUS, NIRS, and OCT, found “triple regression” — simultaneous reduction in percent atheroma volume, reduction in maximum lipid core burden index, and increase in minimum fibreuze kap thickness — in 40.8% of the alirocumab arm versus 23.0% of placebo (p = 0.002), with the triple-regression group achieving a mean LDL-C of 38.4 mg/dL versus 55.7 mg/dL [40].
| Correction to a widely repeated claim
A figure of 70 mg/dL is often cited as the achieved LDL-C “threshold” below which coronary plaqueregressie becomes pronounced. The primary data do not support a threshold. Post hoc analysis of GLAGOV showed coronary plaque regression in direct proportion to achieved LDL-C, with no evident change in slope down to approximately 20 mg/dL; related analyses of intensive PCSK9 inhibition, including Huygens in acute coronary syndromes, are consistent with continued plaque benefit at very low achieved LDL-C [39], [41]. The correct statement is narrower: within the achieved LDL-C range studied, these analyses did not identify a clear lower threshold or change in slope for plaque regression. That is what was observed; it is not proof that benefit remains perfectly linear indefinitely, or that every patient benefits equally at the lowest achieved levels. |
At the trial level, regression appears to track outcomes. A systematic review and meta-regression of 17 prospective dyslipidemia-therapy studies (6,333 patients) reported that a 1% decrease in mean percent atheroma volume was associated with a 20% lower MACE risk (adjusted OR 0.82, 95% CI 0.70–0.95, p = 0.011) [42]. That association is between trial-level means. It does not license the inference that lowering an individual patient’s atheroma volume by 1% reduces that patient’s event risk by 20% — that would be an ecological-to-individual extrapolation. Whether apoB-years trajectory change correlates with serial plaque-volume change, and whether that change mediates clinical benefit, remains an open question for the validation program in Section 11.
Two caveats bound the optimism. Regression of plaquevolume is modest in absolute terms and demonstrated over one to two years in patients with established disease; it is not extrapolable to the omkering of decades of accumulated burden. And the genetic evidence establishes an asymmetry that no regression trial can overcome: lifelong genetically determined lower LDL-C confers a risk reduction several-fold larger than the same magnitude of reduction achieved by midlife pharmacotherapy over five years [43]; Mendelian-randomization evidence supports the same lifetime-exposure logic for apoB specifically [44]. Exposure prevented is worth more than exposure treated. That asymmetry is the entire argument for measuring cumulative exposure early rather than reacting to a threshold crossing late.
8. Cumulative apoB Exposure as a Descriptive Metric — and the Barriers to Individual Risk
This section defines what can be computed from a person’s apoB history, and states with equal precision what cannot yet be computed from it. The distinction is the crux of the paper: a descriptive exposure quantity is defensible; an individual risk score derived from it is not.
8.1 The descriptive quantity
ABY = ∫ apoB(t) dt over a defined age window (mg/dL·years)
Cumulative apoB exposure is a legitimate descriptive quantity: the area under an individual’s apoB-versus-age curve over a stated window. It should be computed from measured serial apoB wherever possible, reported for the age window over which it was actually measured, and accompanied by the proportion of the integral that rests on measurement rather than imputation. Exposure derived from imputed apoB should be reported separately and never blended into a single headline figure, because the imputation assumes population-median particle-to-cholesterol behaviour — precisely the assumption that fails in the discordant patients the metric is meant to identify.
A comparison against the CARDIA-derived reference of roughly 75 mg/dL is interpretable within ages 18 to 40, the window in which that spline-derived reference point was observed. Beyond age 40 the reference has no anchoring: nothing establishes that 75 mg/dL is the appropriate comparator at 55, 70, or 85, that a person slightly above it has meaningfully accrued exposure debt, that 75 represents a biological zero-risk value, or that the relationship holds constant after age 40. The source describes this level as one that may represent a goal for young adults — materially weaker than a lifetime denominator.
8.2 Why the exposure cannot be turned into a risk multiplier
The natural temptation is to take a published cumulative-exposure hazard ratio — such as Domanski’s 1.053 per 100 mg/dL·years of cumulative LDL-C exposure — and exponentiate it across an individual’s lifetime to produce a personal risk multiplier. That step is invalid, for several independent reasons, any one of which is sufficient.
- A Cox hazard ratio is defined relative to a modelled comparison and the study’s baseline hazard. Exponentiating it from zero lifetime exposure implies a comparator — a person who accrued no atherogenic particle exposure at all — that does not physiologically exist, and it ignores the model intercept, covariate distribution, competing risks, and cohort calibration.
- Even anchored to a non-zero reference rather than to zero, the result is a cohort-relative association under the original model’s assumptions, not a patient-level multiplier, and it cannot be attached to a validated instrument such as PREVENT.
- The coefficient was estimated over exposure accrued from ages 18 to 40 predicting events from 40 to 66. Applied to exposure accrued across a whole lifetime, it is used outside the conditions of its derivation.
- Producing the multiplier would require translating apoB-years into LDL-years using a population-level relationship — the very relationship this paper argues fails in the individuals the metric exists to identify.
No event-risk multiplier should be produced from cumulative apoB exposure until one is derived directly, in a cohort with serial apoB, and externally validated.
8.3 Why a single measurement cannot be back-cast to age 18
Most patients present without adolescent lipid data, which invites reconstructing the early trajectory from a later value using a population-average annual apoB slope. This does not work at the individual level.
- A population mean is not an individual trajectory. Applied backwards across decades, it produces regression-to-the-mean error in anyone whose apoB moved for a specific reason — weight change, diabetes onset, menopauze, therapy initiation or discontinuation, thyroid or renal disease.
- The standard deviation of observed across-person slopes is not the standard error of a person-specific back-cast. Multiplying an across-person SD across decades yields a wide interval, but not a properly estimated prediction interval.
The CARDIA apoB trajectory analysis reached this conclusion directly: the substantial variance in apoB over time, and the modest association between baseline measures and rates of change, mean that predicting an individual’s future apoB concentration — and therefore their cumulative exposure — from a one-time assessment has low accuracy [16]. Where early measurements are absent, the appropriate output is a set of clearly labelled sensitivity scenarios — a stable lifelong level, a gradual age-related rise, a late metabolic deterioration — presented side by side as sensitivity analyses rather than as competing estimates of the person’s actual history. A single reconstructed central estimate should not be produced.
8.4 Why discordance hazard ratios cannot simply be borrowed or combined
The Copenhagen excess-apoB hazard ratios (Section 4.2) are a real and useful signal, but two constraints govern their use. First, they are defined relative to a specific residual: Copenhagen derived expected apoB by regressing apoB on LDL-C, separately in women and men, among participants with triglycerides at or below 1 mmol/L (89 mg/dL). The category cut-points and their hazard ratios are defined against that residual, so substituting a different expected-apoB equation would change who falls into each category, and the hazard ratios would no longer describe the patients being classified. Any use of the Copenhagen categories must reproduce its actual sex-specific regressions, not an approximation of them.
Second, the Copenhagen hazard ratios must not be multiplied by the Domanski cumulative-exposure hazard ratio to build a composite. The two exposures overlap biologically and statistically; multiplying them assumes independence and double-counts the same particle-related risk. A joint estimate would require both variables entered in a single model, with collinearity and interaction assessed, cohort-specific calibration, and external validation — not a product of two hazard ratios drawn from different cohorts.
8.5 Why plaque change cannot be converted into individual event reduction
The trial-level association between mean plaque regression and mean event reduction (Section 7) is ecological. It relates group averages across trials. It does not establish that lowering a particular patient’s atheroma volume by one percentage point reduces that patient’s event risk by any fixed amount, it does not transfer outside the studied populations and treatments, and it assumes plaque-volume change captures the whole treatment effect. Translating it into an individual event projection is an ecological-to-individual error. Whether apoB-years trajectory change correlates with serial plaque-volume change, and whether that change mediates clinical benefit, is a question for the validation program in Section 11, not a calculation to perform today.
8.6 What a research index may and may not contain
A limited research index of the form above — cumulative measured apoB exposure over a defined window, reported with its measured-versus-imputed share and, within ages 18 to 40, a ratio against the CARDIA reference — is a reasonable object to define and then test. What it must not contain, until each is separately derived and validated, is an event-risk multiplier, a composite of overlapping hazard ratios, a back-cast central estimate, a projected plaque or event trajectory, or clinical risk categories carrying recommended actions. Candidate exposure bands may be prespecified for the purpose of testing them, but a research analysis plan is better served by predefining quantiles or continuous spline terms than by inventing labelled categories that will be read as validated risk tiers regardless of any disclaimer attached.
9. Validation Status: What This Is Not
This section states plainly what the descriptive measure is not, so that no reader mistakes it for a validated risk instrument.
- Neither apoB-years nor LDL-years is a validated clinical metric. No guideline reviewed in Section 10 operationalizes or endorses a cumulative-exposure calculation for routine care.
- Any candidate exposure bands are constructed by reasoning outward from a single cohort reference point observed over ages 18 to 40. They have never been tested against outcomes, and this paper attaches no clinical action to them.
- Back-casting a person’s early exposure carries uncertainty that in many patients would exceed the width of any candidate band. This is the single largest technical barrier to a retrospective cumulative-exposure measure, and it is not solvable with better statistics — it requires lipid data that most adults do not have.
- Any apoB-to-LDL-C conversion assumes population-median behaviour in an individual — precisely the assumption that fails in the discordant patients the metric exists to identify. Imputed exposure must therefore be reported separately from measured exposure rather than blended with it.
- Cumulative exposure computed by trapezoidal integration from sparse clinical panels is not the quantity the published hazard ratios describe. Those were derived from spline-based mixed models that borrowed information across an entire cohort. The two have never been compared.
- Cumulative exposure is biologically and epidemiologically linked to anatomical disease burden, but its ability to predict an individual’s plaque trajectory has not been directly validated, and it is particularly limited for predicting the timing of clinical events. The measure proposed here should not substitute for imaging where imaging is independently clinically indicated for anatomical risk assessment.
The appropriate positioning is therefore a descriptive research measure that makes visible a variable clinicians already believe matters, considered alongside — never instead of — the validated instruments (the PREVENT equations, guideline lipid goals, and coronary artery calcium or CT angiography where independently indicated). It should not carry a risk estimate, a category label, or a recommended action until each has been derived and externally validated.
10. Guideline Trajectory
Guideline movement supports the cumulative-exposure concept. It does not validate apoB-years arithmetic, historical back-casting, exposure ratios, or exposure-based treatment thresholds, and the distinction should be kept sharp.
The 2026 ACC/AHA/multisociety dyslipidemia guideline retires and replaces the 2018 cholesterol guideline and is retitled to reflect atherogenic lipoproteins beyond LDL-C, including triglyceride-rich remnants and Lp(a) [4]. It replaces the Pooled Cohort Equations with the PREVENT-ASCVD equations, which estimate both 10-year and 30-year risk — an explicitly lifetime-oriented framing. It restores absolute LDL-C goals by risk stratum (<100, <70, and <55 mg/dL). It recommends Lp(a) measurement at least once in every adult’s lifetime. It endorses selective apoB measurement to assess residual atherogenic particle burden, particularly in patients with triglycerides above 200 mg/dL, diabetes, or achieved LDL-C below 70 mg/dL. And its central framing — earlier intervention to reduce prolonged exposure — is the cumulative-exposure argument in all but name [5], [45].
The 2024 National Lipid Association expert consensus went further on apoB specifically, proposing apoB thresholds of 60, 70, and 90 mg/dL for very-high-, high-, and borderline-to-intermediate-risk patients respectively, and stating that apoB and non-HDL-C stratify risk more accurately than LDL-C where the measures disagree [46]. The 2019 ESC/EAS guidelines give apoB a Class I, Level C recommendation for risk assessment, preferentially in metabool syndroom, diabetes, obesity, and very low achieved LDL-C, and permit its use as the primary measurement for screening, diagnosis, and management [47]. The Canadian Cardiovascular Society similarly recommends apoB or non-HDL-C as preferred screening markers in hypertriglyceridemia [48].
None of the societies or guidelines reviewed here operationalizes a cumulative-exposure calculation. The biology is increasingly accepted; the arithmetic has not been derived, calibrated, or validated. That gap is what the research program in Section 11 is meant to close, and it is not closed by proposing a formula.
11. A Validation Program
The following would move apoB-years from concept to instrument, in ascending order of cost.
Tier 1 — Retrospective derivation in existing cohorts
Candidate cohorts include CARDIA, MESA, Framingham Offspring, the Copenhagen General Population Study, and UK Biobank. Suitability would depend on the availability, timing, assay method, and density of serial apoB measurements and stored specimens, which differ substantially between them and must be established from each cohort’s own data documentation before that cohort is committed to this analysis. Where that condition is met, compute cumulative exposure using measured serial apoB only, by the same spline-based mixed-model approach used in the source analyses, and separately by trapezoidal integration from a deliberately thinned subset of visits that mimics real clinical density. Comparing those two is itself a necessary study: it establishes whether a clinically computable approximation recovers the quantity the published hazard ratios describe. Then test discrimination and calibration for incident ASCVD against the current-value model, quantifying incremental C-statistic, net reclassification, and integrated discrimination over PREVENT. The null hypothesis to be defeated is that cumulative exposure adds nothing beyond current apoB plus age.
Tier 2 — Back-cast validation
Within cohorts holding true adolescent measurements, compare back-cast estimates against measured values to derive empirical error bands by age gap and by covariate profile. This is the study that determines whether a retrospective exposure estimate is viable at all in patients presenting after age 45, and it may be feasible in existing cohorts holding sufficiently dense adolescent and adult measurements.
Tier 3 — Anatomical anchoring
In cohorts with repeat quantitative coronary CTA — the PARADIGM registry, a prospective multinational registry of patients undergoing serial CCTA, is the clearest established example [49], and any further cohort, including SCAPIS or MESA, would first have to be shown to hold repeat quantitative CCTA suitable for measuring plaque-volume change — regress plaque volume and low-attenuation plaque volume on ABY to establish whether the milestone thresholds that currently circulate without provenance have any empirical basis. This is where the vacant cells of every published apoB-years milestone table would finally be filled with real numbers.
Tier 4 — Prospective and interventional
Prospective registry deployment measuring whether reporting cumulative apoB exposure changes physician prescribing, patient naleving, and downstream lipid trajectory; ultimately, a randomized comparison of exposure-guided versus guideline-goal-guided management with imaging or event endpoints. Only the last of these can establish that the metric improves outcomes rather than merely predicting them.
12. Conclusion
The case for cumulative apoB exposure rests on four claims of sharply differing strength. That plaque accumulation is strongly related to both the magnitude and the duration of exposure to apoB-bevattende deeltjes — integration over time being a biologically motivated approximation of that cumulative exposure — is well supported by mechanism and consistent with the available human data. That cumulative exposure predicts ASCVD independent of contemporaneous lipid values is demonstrated in multiple cohorts for LDL-C and in one important CARDIA analysis for apoB. That risk tracks apoB more closely than LDL-C where the two disagree — in a fraction of adults that varies from roughly 5% to 25% by definition, treatment status, and LDL-C estimation method, concentrating in the insulin-resistant and diabetic phenotype — is supported consistently across the available discordance analyses. That a specific cumulative-exposure number should guide a specific clinical decision is not established at all, and the distance between the third claim and the fourth is larger than enthusiasm for the concept tends to suggest.
The productive path is to treat cumulative apoB exposure as a candidate metric requiring derivation, calibration, and external validation, and to resist the temptation to publish coefficients before they exist. A disclaimer does not make an invalid calculation valid. At the same time, the status quo is not neutral: current practice necessarily relies primarily on contemporaneous measurements despite the chronic, cumulative nature of atherosclerosis, and does so in a population increasingly composed of patients whose LDL-C understates their particle burden — a limitation with a known direction. Both statements are true, and the second does not license shortcuts on the first.
Referenties
- Domanski MJ, Tian X, Wu CO, et al. Time Course of LDL Cholesterol Exposure and Cardiovascular Disease Event Risk. J Am Coll Cardiol. 2020;76(13):1507-1516. doi:10.1016/j.jacc.2020.07.059
- Shapiro MD, Bhatt DL. “Cholesterol-Years” for ASCVD Risk Prediction and Treatment. J Am Coll Cardiol. 2020;76(13):1517-1520. doi:10.1016/j.jacc.2020.08.004
- Zheutlin AR, Handoo F, Luebbe S, et al. Cumulative exposure to atherogenic lipoprotein particles in young adults and subsequent incident atherosclerotic cardiovascular disease. Eur Heart J. 2025;46(41):4302-4312. doi:10.1093/eurheartj/ehaf472
- Writing Committee Members, Blumenthal RS, Morris PB, et al. 2026 ACC/AHA/AACVPR/ABC/ACPM/ADA/AGS/APhA/ASPC/NLA/PCNA Guideline on the Management of Dyslipidemia: A Report of the American College of Cardiology/American Heart Association Joint Committee on Clinical Practice Guidelines. Circulation. 2026;153(17):e1154-e1276. doi:10.1161/CIR.0000000000001423
- Lower sooner: how the 2026 dyslipidemia guideline changes practice. Cardiology Magazine. American College of Cardiology; July 2026. Accessed August 10, 2026.
- Grundy SM, Stone NJ, Bailey AL, et al. 2018 AHA/ACC/AACVPR/AAPA/ABC/ACPM/ADA/AGS/APhA/ASPC/NLA/PCNA Guideline on the Management of Blood Cholesterol: A Report of the American College of Cardiology/American Heart Association Task Force on Clinical Practice Guidelines. Circulation. 2019;139(25):e1082-e1143. doi:10.1161/CIR.0000000000000625
- Williams KJ, Tabas I. The response-to-retention hypothesis of early atherogenesis. Arterioscler Thromb Vasc Biol. 1995;15(5):551-561. doi:10.1161/01.atv.15.5.551
- Tabas I, Williams KJ, Borén J. Subendothelial lipoprotein retention as the initiating process in atherosclerosis: update and therapeutic implications. Circulation. 2007;116(16):1832-1844. doi:10.1161/CIRCULATIONAHA.106.676890
- Williams KJ, Tabas I. The response-to-retention hypothesis of atherogenesis reinforced. Curr Opin Lipidol. 1998;9(5):471-474. doi:10.1097/00041433-199810000-00012
- Kumarapperuma H, Chia ZJ, Malapitan SM, Wight TN, Little PJ, Kamato D. Response to retention hypothesis as a source of targets for arterial wall-directed therapies to prevent atherosclerosis: A critical review. Atherosclerosis. 2024;397:118552. doi:10.1016/j.atherosclerosis.2024.118552
- Sniderman AD, Thanassoulis G, Glavinovic T, et al. Apolipoprotein B Particles and Cardiovascular Disease: A Narrative Review. JAMA Cardiol. 2019;4(12):1287-1295. doi:10.1001/jamacardio.2019.3780
- Rosenson RS, Hegele RA, Gotto AM Jr. Integrated Measure for Atherogenic Lipoproteins in the Modern Era: Risk Assessment Based on Apolipoprotein B. J Am Coll Cardiol. 2016;67(2):202-204. doi:10.1016/j.jacc.2015.10.059
- De Oliveira-Gomes D, Joshi PH, Peterson ED, Rohatgi A, Khera A, Navar AM. Apolipoprotein B: Bridging the Gap Between Evidence and Clinical Practice. Circulation. 2024;150(1):62-79. doi:10.1161/CIRCULATIONAHA.124.068885
- Zhang Y, Pletcher MJ, Vittinghoff E, et al. Association Between Cumulative Low-Density Lipoprotein Cholesterol Exposure During Young Adulthood and Middle Age and Risk of Cardiovascular Events. JAMA Cardiol. 2021;6(12):1406-1413. doi:10.1001/jamacardio.2021.3508
- Navar-Boggan AM, Peterson ED, D’Agostino RB Sr, Neely B, Sniderman AD, Pencina MJ. Hyperlipidemia in early adulthood increases long-term risk of coronary heart disease. Circulation. 2015;131(5):451-458. doi:10.1161/CIRCULATIONAHA.114.012477
- Wilkins JT, Ning H, Sniderman A, et al. Analysis of apoB Concentrations Across Early Adulthood and Predictors for Rates of Change Using CARDIA Study Data. J Lipid Res. 2022;63(12):100299. doi:10.1016/j.jlr.2022.100299
- Tang R, An J, Bellows BK, et al. Traditional and Emerging Lipid Markers for Cardiovascular Risk Assessment in Young vs Older Adults. JAMA Netw Open. 2026;9(4):e265199. doi:10.1001/jamanetworkopen.2026.5199
- Varvel SA, Dayspring TD, Edmonds Y, et al. Discordance between apolipoprotein B and low-density lipoprotein particle number is associated with insulin resistance in clinical practice. J Clin Lipidol. 2015;9(2):247-255. doi:10.1016/j.jacl.2014.11.005
- Johannesen CDL, Mortensen MB, Nordestgaard BG, Langsted A. Discordance analyses comparing LDL cholesterol, Non-HDL cholesterol, and apolipoprotein B for cardiovascular risk estimation. Atherosclerosis. 2025;403:119139. doi:10.1016/j.atherosclerosis.2025.119139
- Wilkins JT, Li RC, Sniderman A, Chan C, Lloyd-Jones DM. Discordance Between Apolipoprotein B and LDL-Cholesterol in Young Adults Predicts Coronary Artery Calcification: The CARDIA Study. J Am Coll Cardiol. 2016;67(2):193-201. doi:10.1016/j.jacc.2015.10.055
- Johannesen CDL, Langsted A, Nordestgaard BG, Mortensen MB. Excess Apolipoprotein B and Cardiovascular Risk in Women and Men. J Am Coll Cardiol. 2024;83(23):2262-2273. doi:10.1016/j.jacc.2024.03.423
- Sehayek D, Cole J, Björnson E, et al. ApoB, LDL-C, and non-HDL-C as markers of cardiovascular risk. J Clin Lipidol. 2025;19(4):844-859. doi:10.1016/j.jacl.2025.05.024
- Sayed A, Peterson ED, Virani SS, Sniderman AD, Navar AM. Individual Variation in the Distribution of Apolipoprotein B Levels Across the Spectrum of LDL-C or Non-HDL-C Levels. JAMA Cardiol. 2024;9(8):741-747. doi:10.1001/jamacardio.2024.1310
- Björklund P, Härdfeldt J, Äikäs L, et al. Increased transvascular retention of atherogenic lipoproteins in type 2 diabetes relates to their enhanced proteoglycan binding. JCI Insight. 2026;11(10):e177849. doi:10.1172/jci.insight.177849
- Mazidi M, Webb RJ, Lip GYH, Kengne AP, Banach M, Davies IG. Discordance between LDL-C and Apolipoprotein B Levels and Its Association with Renal Dysfunction: Insights from a Population-Based Study. J Clin Med. 2022;11(2):313. doi:10.3390/jcm11020313
- Giannakopoulou SP, Antonopoulou S, Barkas F, et al. Concordance-discordance between apolipoprotein B and lipid biomarkers in predicting 20-year atherosclerotic cardiovascular disease risk: The ATTICA study (2002-2022). Eur J Clin Invest. 2025;55(10):e70077. doi:10.1111/eci.70077
- McGill HC Jr, McMahan CA, Herderick EE, Malcom GT, Tracy RE, Strong JP. Origin of atherosclerosis in childhood and adolescence. Am J Clin Nutr. 2000;72(5 Suppl):1307S-1315S. doi:10.1093/ajcn/72.5.1307s
- McGill HC Jr, McMahan CA, Malcom GT, Oalmann MC, Strong JP. Effects of serum lipoproteins and smoking on atherosclerosis in young men and women. The PDAY Research Group. Pathobiological Determinants of Atherosclerosis in Youth. Arterioscler Thromb Vasc Biol. 1997;17(1):95-106. doi:10.1161/01.atv.17.1.95
- Berenson GS, Srinivasan SR, Bao W, Newman WP 3rd, Tracy RE, Wattigney WA. Association between multiple cardiovascular risk factors and atherosclerosis in children and young adults. The Bogalusa Heart Study. N Engl J Med. 1998;338(23):1650-1656. doi:10.1056/NEJM199806043382302
- Gidding SS, McMahan CA, McGill HC, et al. Prediction of coronary artery calcium in young adults using the Pathobiological Determinants of Atherosclerosis in Youth (PDAY) risk score: the CARDIA study. Arch Intern Med. 2006;166(21):2341-2347. doi:10.1001/archinte.166.21.2341
- Hartiala O, Magnussen CG, Kajander S, et al. Adolescence risk factors are predictive of coronary artery calcification at middle age: the cardiovascular risk in young Finns study. J Am Coll Cardiol. 2012;60(15):1364-1370. doi:10.1016/j.jacc.2012.05.045
- Steffen BT, Guan W, Remaley AT, et al. Apolipoprotein B is associated with carotid atherosclerosis progression independent of individual cholesterol measures in a 9-year prospective study of Multi-Ethnic Study of Atherosclerosis participants. J Clin Lipidol. 2017;11(5):1181-1191.e1. doi:10.1016/j.jacl.2017.07.001
- Wallenfeldt K, Bokemark L, Wikstrand J, Hulthe J, Fagerberg B. Apolipoprotein B/apolipoprotein A-I in relation to the metabolic syndrome and change in carotid artery intima-media thickness during 3 years in middle-aged men. Stroke. 2004;35(10):2248-2252. doi:10.1161/01.STR.0000140629.65145.3c
- Stone GW, Maehara A, Lansky AJ, et al. A prospective natural-history study of coronary atherosclerosis. N Engl J Med. 2011;364(3):226-235. doi:10.1056/NEJMoa1002358
- Erlinge D, Maehara A, Ben-Yehuda O, et al. Identification of vulnerable plaques and patients by intracoronary near-infrared spectroscopy and ultrasound (PROSPECT II): a prospective natural history study. Lancet. 2021;397(10278):985-995. doi:10.1016/S0140-6736(21)00249-X
- Williams MC, Kwiecinski J, Doris M, et al. Low-Attenuation Noncalcified Plaque on Coronary Computed Tomography Angiography Predicts Myocardial Infarction: Results From the Multicenter SCOT-HEART Trial (Scottish Computed Tomography of the HEART). Circulation. 2020;141(18):1452-1462. doi:10.1161/CIRCULATIONAHA.119.044720
- Tzolos E, Williams MC, McElhinney P, et al. Pericoronary Adipose Tissue Attenuation, Low-Attenuation Plaque Burden, and 5-Year Risk of Myocardial Infarction. JACC Cardiovasc Imaging. 2022;15(6):1078-1088. doi:10.1016/j.jcmg.2022.02.004
- Jia H, Abtahian F, Aguirre AD, et al. In vivo diagnosis of plaque erosion and calcified nodule in patients with acute coronary syndrome by intravascular optical coherence tomography. J Am Coll Cardiol. 2013;62(19):1748-1758. doi:10.1016/j.jacc.2013.05.071
- Nicholls SJ, Puri R, Anderson T, et al. Effect of Evolocumab on Progression of Coronary Disease in Statin-Treated Patients: The GLAGOV Randomized Clinical Trial. JAMA. 2016;316(22):2373-2384. doi:10.1001/jama.2016.16951
- Biccirè FG, Häner J, Losdat S, et al. Concomitant Coronary Atheroma Regression and Stabilization in Response to Lipid-Lowering Therapy. J Am Coll Cardiol. 2023;82(18):1737-1747. doi:10.1016/j.jacc.2023.08.019
- Nicholls SJ, Kataoka Y, Nissen SE, et al. Coronary Atheroma Regression With Evolocumab in Stable and Unstable Coronary Syndromes. JACC Cardiovasc Imaging. 2023;16(1):130-132. doi:10.1016/j.jcmg.2022.07.020
- Iatan I, Guan M, Humphries KH, Yeoh E, Mancini GBJ. Atherosclerotic Coronary Plaque Regression and Risk of Adverse Cardiovascular Events: A Systematic Review and Updated Meta-Regression Analysis. JAMA Cardiol. 2023;8(10):937-945. doi:10.1001/jamacardio.2023.2731
- Ference BA, Ginsberg HN, Graham I, et al. Low-density lipoproteins cause atherosclerotic cardiovascular disease. 1. Evidence from genetic, epidemiologic, and clinical studies. A consensus statement from the European Atherosclerosis Society Consensus Panel. Eur Heart J. 2017;38(32):2459-2472. doi:10.1093/eurheartj/ehx144
- Richardson TG, Wang Q, Sanderson E, et al. Effects of apolipoprotein B on lifespan and risks of major diseases including type 2 diabetes: a mendelian randomisation analysis using outcomes in first-degree relatives. Lancet Healthy Longev. 2021;2(6):e317-e326. doi:10.1016/S2666-7568(21)00086-6
- Wiggins BS, Barac A, Benziger CP, et al. 2026 Dyslipidemia Guideline-at-a-Glance. J Am Coll Cardiol. 2026;87(19):2617-2623. doi:10.1016/j.jacc.2026.02.4872
- Soffer DE, Marston NA, Maki KC, et al. Role of apolipoprotein B in the clinical management of cardiovascular risk in adults: An Expert Clinical Consensus from the National Lipid Association. J Clin Lipidol. 2024;18(5):e647-e663. doi:10.1016/j.jacl.2024.08.013
- Mach F, Baigent C, Catapano AL, et al. 2019 ESC/EAS Guidelines for the management of dyslipidaemias: lipid modification to reduce cardiovascular risk. Eur Heart J. 2020;41(1):111-188. doi:10.1093/eurheartj/ehz455
- Pearson GJ, Thanassoulis G, Anderson TJ, et al. 2021 Canadian Cardiovascular Society Guidelines for the Management of Dyslipidemia for the Prevention of Cardiovascular Disease in Adults. Can J Cardiol. 2021;37(8):1129-1150. doi:10.1016/j.cjca.2021.03.016
- Lee SE, Chang HJ, Rizvi A, et al. Rationale and design of the Progression of AtheRosclerotic PlAque DetermIned by Computed TomoGraphic Angiography IMaging (PARADIGM) registry: a comprehensive exploration of plaque progression and its impact on clinical outcomes from a multicenter serial coronary computed tomographic angiography study. Am Heart J. 2016;182:72-79. doi:10.1016/j.ahj.2016.09.003
- Soto-Mota A, Norwitz NG, Manubolu VS, et al. Plaque begets plaque, ApoB does not: longitudinal data from the KETO-CTA trial. JACC Adv. 2025;4(7):101686. doi:10.1016/j.jacadv.2025.101686. [Retracted]
- Expression of Concern: “Plaque Begets Plaque. ApoB Does Not: Longitudinal Data from The KETO-CTA Trial” [JACC: Advances, Volume 4, Issue 7, July 2025, Article 101686]. JACC Adv. 2026;5(3):102607. doi:10.1016/j.jacadv.2026.102607
- Kaplan H, Thompson RC, Trumble BC, et al. Coronary atherosclerosis in indigenous South American Tsimane: a cross-sectional cohort study. Lancet. 2017;389(10080):1730-1739. doi:10.1016/S0140-6736(17)30752-3
Disclosure and status. This is a verhalend overzicht and research framework. It defines cumulative apoB exposure as a descriptive measure and argues explicitly that it is not yet a validated individual risk metric; it recommends no cumulative-exposure threshold and provides no individual risk score. Reference [23] uses the online-published version of the cited JAMA Cardiology article; page numbers follow the print issue. Clinical decisions should follow current guideline recommendations.