
Plain-Language Guide to Heart Disease Risk
| WHY | Heart disease is the leading cause of death in the world. But doctors now have powerful new tools to find it earlier and prevent it — if they know where to look. This guide explains those tools in plain terms. |
What Is Heart Disease and How Does It Start?
Heart disease usually begins with a slow, silent process called atherosclerosis — the build-up of fatty, waxy deposits (called plaque) inside the walls of your arteries, the tubes that carry blood around your body. Over many years, this plaque can grow and harden, narrowing the arteries and reducing blood flow. If a plaque suddenly breaks open, it can trigger a blood clot that blocks the artery completely — causing a heart attack or stroke.
For decades, doctors estimated who was at risk using a short checklist: age, blood pressure, cholesterol, smoking, and diabetes. These factors still matter, but research has shown that this checklist misses many people who are in real danger — and sometimes flags people who are actually fine. The next generation of heart disease prevention goes much deeper.
The Old Approach and Its Limits
The traditional approach adds up a few numbers from a blood test and gives every patient a percentage chance of having a heart attack in the next ten years. It works reasonably well for large populations, but it treats everyone with similar numbers the same way — even though the biology of cardiovascular disease is very different from person to person.
Two patients can have identical calculated risk scores yet have completely different levels of actual disease in their arteries. One may have no detectable plaque at all, while the other may be quietly accumulating dangerous deposits. Without looking more closely, we cannot tell them apart.
| KEY IDEA | Traditional risk scores estimate probability from averages. The new approach measures what is actually happening in your blood vessels and biology right now. |
Better Blood Tests: What They Reveal
ApoB — Counting the Dangerous Particles
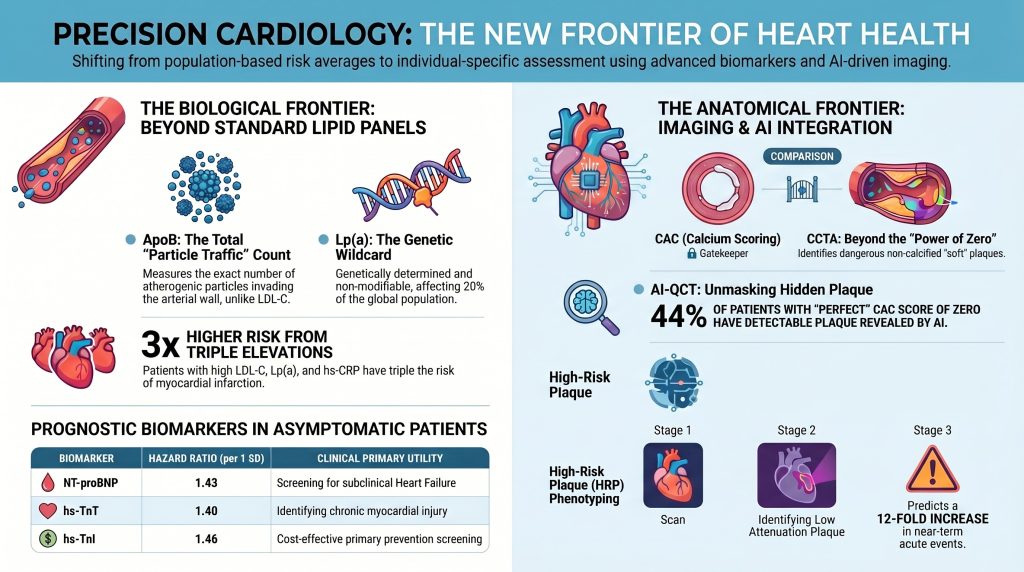
Your standard cholesterol test measures the amount of cholesterol floating in your blood. But the real danger comes from the number of tiny particles carrying that cholesterol into your artery walls. A protein called ApoB sits on every single one of those dangerous particles — exactly one per particle. Measuring ApoB gives doctors an exact count of how many ‘invasion vehicles’ are circulating in your blood.
Why does this matter? Some people have normal-looking cholesterol but a very high number of particles — especially people with diabetes, belly fat, or metabolic syndrome. Without checking ApoB, that hidden danger goes unnoticed. In people where standard cholesterol and ApoB disagree, ApoB is the more reliable guide to true cardiovascular risk.
Lp(a) — The Genetic Wildcard
Lipoprotein(a), written as Lp(a), is a special particle that is almost entirely controlled by your genes — not your diet or exercise habits. About one in five people worldwide has a dangerously high level of Lp(a), placing them at much greater risk for heart attacks, strokes, and even heart valve disease. Most standard checkups never test for it.
Lp(a) is particularly important because common cholesterol medications (statins) do not lower it. So a person could be taking their medication faithfully and eating well — yet still face elevated risk because of this inherited factor. The good news: new drugs specifically targeting Lp(a) are now in late-stage clinical trials, making identification of affected patients more urgent than ever. Current guidelines recommend testing Lp(a) at least once in every adult’s lifetime.
hs-CRP — Measuring Inflammation
Atherosclerosis is not just a plumbing problem — it is also driven by inflammation. High-sensitivity C-reactive protein (hs-CRP) is a blood marker that rises when there is chronic, low-level inflammation in the body. When hs-CRP is at or above 2.0 mg/L, it signals that plaque in the arteries may be more ‘active’ and unstable — more likely to rupture and cause a heart attack. For people in the middle range on standard risk calculators, an elevated hs-CRP can tip the balance toward starting preventive treatment earlier.
Cardiac Markers — Listening to the Heart Itself
Two newer tests — high-sensitivity troponin (hs-Tn) and NT-proBNP — measure whether the heart muscle is already under stress or has suffered subtle injury, even in people with no symptoms. Troponin is released when heart cells are damaged. NT-proBNP is released when the heart is working under pressure. In asymptomatic adults, elevated levels of either marker signal that cardiovascular disease may already be progressing beneath the surface, and that closer attention or earlier treatment may be warranted.
Better Scans: Seeing the Disease Directly
The CAC Scan — Finding Hardened Plaque
A Coronary Artery Calcium (CAC) scan is a quick, painless CT scan — no dye required — that measures the amount of calcified, hardened plaque in the arteries around your heart. The result is your CAC score.
- A score of 0 means no calcified plaque is visible. For most people, this is reassuring — more than 95 out of 100 with this score will not have a heart attack in the next ten years.
- A score above 100, or in the top quarter for your age and sex, strongly suggests you need preventive medication and possibly more investigation.
Important limitation: The CAC scan only shows old, hardened plaque. It completely misses soft, fatty plaque — which is often the most dangerous kind, especially in younger people and women. A score of zero means low observed risk, not the complete absence of disease.
CCTA — The Full Picture of Your Arteries
A CT Coronary Angiography (CCTA) uses a dye injection and a more advanced scanner to show doctors the entire inside of the coronary arteries — both the hardened plaque and the soft, dangerous plaque. It can also detect whether an artery is significantly narrowed and identify specific features that make plaque more likely to rupture.
A major clinical trial called SCOT-HEART found that patients who received CCTA had a 41% lower chance of a fatal or non-fatal heart attack over five years, compared to standard care. That is because the scan found hidden disease earlier and prompted more targeted preventive treatment — often not surgery or procedures, but earlier medication and lifestyle changes.
AI-Powered Plaque Analysis — Finding What Eyes Miss
Artificial intelligence software can now analyze CCTA scans in seconds, measuring the exact amount and type of every plaque deposit automatically. This has revealed a surprising finding: roughly 25 to 50 percent of people with a CAC score of zero — who would traditionally be told ‘you’re fine’ — actually have detectable soft plaque when analyzed by AI. This is particularly common in women and younger adults who are currently underserved by traditional screening approaches.
Putting It All Together: A Four-Layer Strategy
The most advanced approach to heart disease prevention layers these tools together for each patient, moving from simple estimates to direct disease measurement:
- Layer 1 — Basic Risk Estimate: Use the newest standard calculator (called PREVENT) with your blood pressure, cholesterol, and kidney function numbers to get a starting risk estimate.
- Layer 2 — Genetic Check: Test Lp(a) once in your lifetime to uncover genetic risk that standard calculators miss.
- Layer 3 — Biology Check: For people in the middle-risk zone, add ApoB, hs-CRP, and metabolic markers to see how active the disease process is right now.
- Layer 4 — Direct Scan: Use a CAC scan as the first imaging step, or a CCTA scan for a full picture of both hard and soft plaque, especially when other risk signals are concerning.
The Bottom Line
Heart disease prevention has entered a new era. Blood tests now count the dangerous particles in your blood directly. Scans can now show actual plaque building up in your arteries. AI tools find hidden disease that even skilled specialists can miss.
The message from the latest science and guidelines is straightforward: finding the right risk, in the right person, at the right time is the key to preventing heart attacks and saving lives. The tools already exist. The challenge is making sure every patient gets access to them.
| ACTION | Ask your doctor: Have I had my Lp(a) tested? Should I have a CAC scan? Is my ApoB level in a safe range? These simple questions could make all the difference. |
DEEP DIVE
Advanced Paradigms in Cardiovascular Risk Assessment:
Integration of Biomarkers and Imaging in Precision Cardiology
Abstract
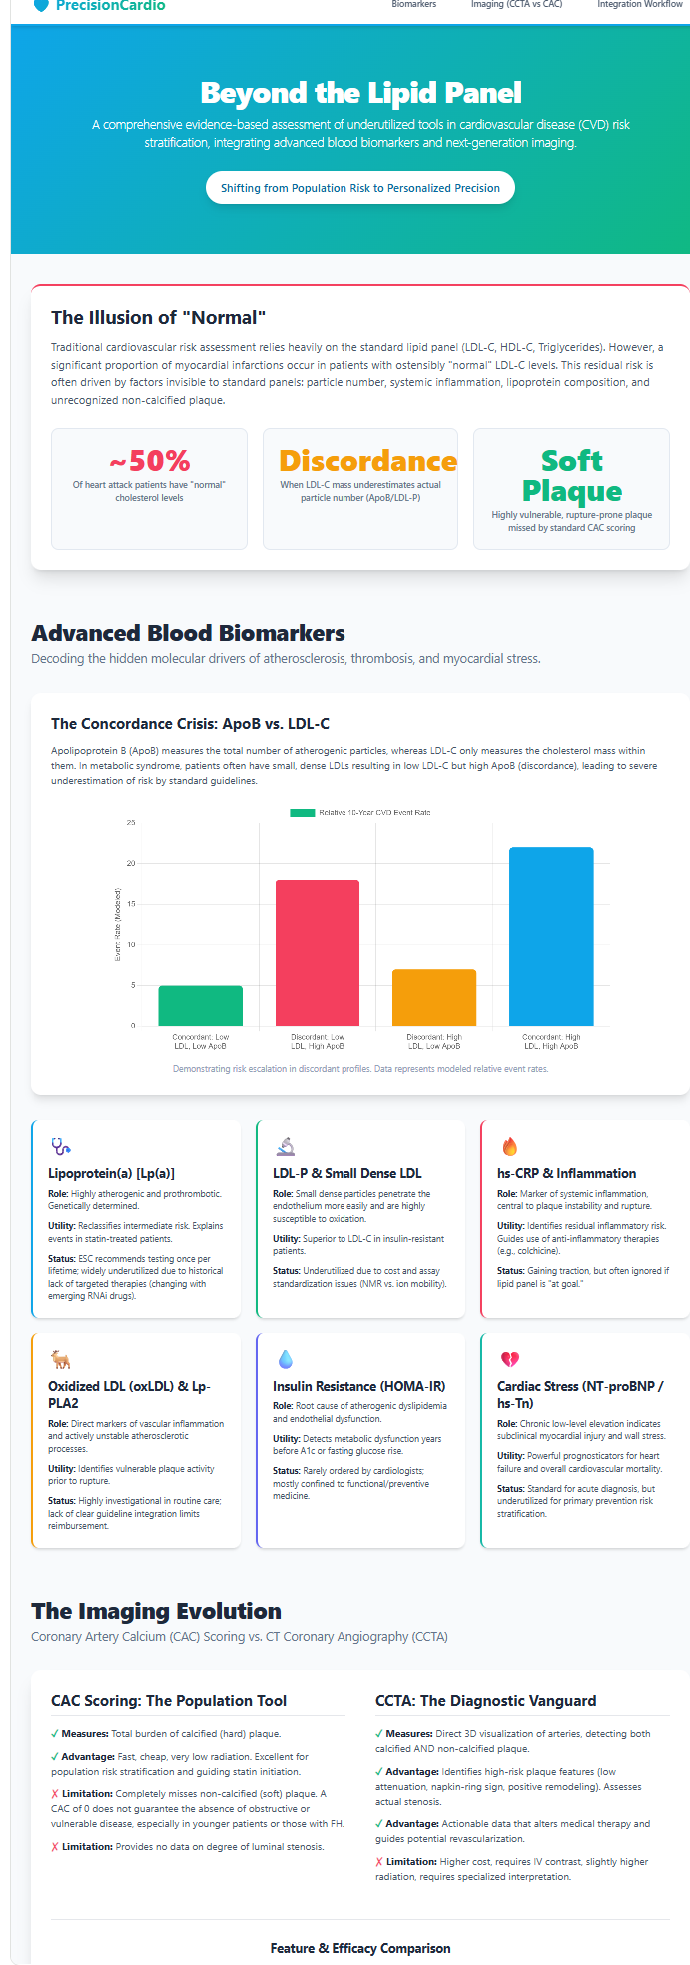
Cardiovascular disease (CVD) remains the leading cause of morbidity and mortality worldwide despite major advances in prevention, pharmacotherapy, and imaging. Traditional risk assessment tools, including the Framingham Risk Score and the ACC/AHA Pooled Cohort Equations, have provided the foundation for preventive cardiology for decades, yet their limitations at the individual level have become increasingly apparent. These models estimate the probability of future events on the basis of demographic and clinical risk factors, but they do not directly quantify atherosclerotic burden, plaque biology, or subclinical myocardial injury. As a result, a substantial proportion of cardiovascular events continue to occur in people categorized as low or intermediate risk, while some individuals designated as high risk by conventional models may have little demonstrable disease.
This mismatch has driven the emergence of precision cardiology — an approach that integrates advanced lipid markers, inflammatory and metabolic biomarkers, genetic predisposition, cardiac-specific markers, and anatomical imaging to produce a more individualized and biologically grounded evaluation of risk. This manuscript reviews advanced blood biomarkers including apolipoprotein B (ApoB), lipoprotein(a) [Lp(a)], small dense low-density lipoprotein (sdLDL), oxidized low-density lipoprotein (oxLDL), high-sensitivity C-reactive protein (hs-CRP), lipoprotein-associated phospholipase A2 (Lp-PLA2), fasting insulin and insulin resistance indices, high-sensitivity troponin (hs-Tn), and NT-proBNP, as well as imaging modalities including coronary artery calcium (CAC) scoring and computed tomography coronary angiography (CCTA). Particular emphasis is placed on the integration of these tools within a layered framework. Current evidence suggests that combining biological and anatomical information improves discrimination, reclassification, and preventive treatment allocation. The transition from population-based prediction toward individualized disease characterization represents a major paradigm shift in cardiovascular prevention and offers an opportunity to reduce the global burden of atherosclerotic disease through earlier, more precise intervention [1]–[27].
Introduction
The modern history of cardiovascular prevention is inseparable from the development of epidemiologic risk prediction. Landmark longitudinal studies identified age, sex, blood pressure, smoking, total cholesterol, and diabetes as the principal determinants of future cardiovascular events and enabled the construction of pragmatic tools to estimate risk in clinical practice [1], [2]. These models transformed preventive care by allowing clinicians to move from a purely reactive approach to one based on anticipated probability, and they also established the framework for guideline-directed treatment thresholds for statins and antihypertensive therapy. Yet as these tools became widely adopted, their weaknesses grew more visible: they work well as population-level estimates, but population-level performance does not guarantee accurate characterization of risk in any given person.
In routine clinical practice, clinicians encounter individuals with apparently acceptable lipid values and modest calculated risk who later present with myocardial infarction, as well as patients with multiple conventional risk factors whose imaging reveals little or no atherosclerotic burden. Traditional calculators do not directly measure atherogenic particle number, inherited proatherogenic states such as elevated Lp(a), inflammatory activity, plaque phenotype, or myocardial stress. They therefore compress a biologically complex process into a limited number of input variables. The consequence is predictable: under-recognition of residual risk, incomplete appreciation of disease heterogeneity, and less precise matching of preventive therapy to true biological need [3], [4].
The PREVENT equations represent a meaningful step forward because they improve calibration, incorporate kidney function, and remove race-based variables [3]. Even so, PREVENT remains a model of probabilistic estimation rather than direct disease detection. It does not answer the increasingly central question of modern preventive cardiology: what is actually happening in this patient’s arteries, myocardium, and underlying biological pathways right now?
That question has become more answerable because advances in lipidology, molecular biomarkers, and noninvasive imaging now allow clinicians to examine cardiovascular risk through multiple complementary lenses. ApoB offers a direct count of atherogenic particles rather than a mass estimate of cholesterol content [6], [7]. Lp(a) identifies a genetically mediated and often silent driver of premature disease [8]–[11]. hs-CRP reflects the inflammatory axis of residual risk [13]. High-sensitivity troponin and NT-proBNP detect subclinical myocardial injury and hemodynamic stress before overt clinical disease appears [16]–[18]. CAC scoring quantifies the burden of calcified plaque, while CCTA evaluates not only stenosis but plaque composition and high-risk morphology [19]–[23]. Artificial intelligence expands the value of imaging by increasing reproducibility and enabling quantitative plaque analysis at scale [24], [25].
The purpose of this manuscript is to synthesize these developments within a coherent framework for cardiovascular risk assessment. Rather than treating biomarkers and imaging as isolated tools, the discussion presents them as components of a biologically and anatomically integrated model. The central argument is that the future of risk assessment lies not in abandoning conventional factors, but in situating them within a broader and more precise architecture that reflects the true pathobiology of atherosclerotic disease.
The Biological Basis of Atherosclerotic Risk
Atherosclerosis begins long before symptoms emerge and long before conventional thresholds of clinical disease are crossed. It is initiated by the retention of ApoB-containing lipoproteins in the subendothelial space of susceptible arterial segments — the key inciting event [5]. Once trapped in the intima, these particles undergo oxidative and enzymatic modification, which makes them potent triggers of endothelial activation and innate immune signaling. Monocytes migrate into the vessel wall, differentiate into macrophages, and ingest modified lipids via scavenger receptors, producing foam cells and fatty streaks. Over time, the lesion evolves into a complex plaque containing lipid pools, necrotic debris, smooth muscle cells, calcification, inflammatory infiltrates, extracellular matrix remodeling, and a fibrous cap of variable thickness [5].
Several implications follow from this biology. First, cholesterol concentration alone is not a sufficient descriptor of atherogenic burden because particle number and behavior matter independently. Second, inflammation is not a secondary bystander phenomenon but a core feature of plaque initiation, progression, and destabilization. Third, plaque rupture depends not only on plaque size but on composition and biological activity — small plaques with large lipid-rich necrotic cores and thin fibrous caps rupture more readily than large, calcified, stable lesions. Fourth, the myocardium itself may signal stress or injury well before a patient develops angina, heart failure, or overt ischemic events. In short, cardiovascular risk is the cumulative product of particle exposure, inherited susceptibility, inflammatory tone, metabolic dysfunction, plaque phenotype, and myocardial response.
The inadequacy of simplified risk estimation models is rooted in the complexity of the disease itself. If atherosclerosis is driven by several partially independent biological axes, then accurate risk assessment must interrogate those axes directly. This is the fundamental rationale for expanding cardiovascular evaluation beyond LDL-C and conventional risk factors.
Traditional Risk Scores: Utility and Limits
Traditional risk scores remain indispensable because they are accessible, validated, and easy to implement. They provide a starting point for estimating absolute risk and help identify broad groups who benefit from preventive therapy [1], [2]. They also support public health strategy by translating decades of epidemiologic evidence into a usable bedside instrument. It would be a mistake to dismiss them.
However, their strengths are inseparable from their simplifications. Age exerts enormous weight in these models, often overshadowing biological risk factors in younger adults who may already harbor significant subclinical disease. Conversely, older age can drive risk estimates upward even when imaging and biomarker profiles suggest relatively low biological activity. The models generally assume that measured risk factors adequately proxy the underlying disease process, which is often not the case. LDL-C is treated as the primary lipid variable despite substantial interindividual variation in particle number and composition. Inflammation, inherited lipoprotein abnormalities, and plaque phenotype are not captured. Family history is inconsistently incorporated or underweighted [3], [4].
These limitations are especially consequential in certain phenotypes. Patients with metabolic syndrome or type 2 diabetes often have deceptively normal LDL-C despite elevated ApoB and atherogenic remnant burden. Individuals with very high Lp(a) may appear low risk on a traditional calculator until they experience a premature event. Women and younger adults may have noncalcified plaque that is invisible to calcium scoring yet clinically meaningful on CCTA. Patients with persistent inflammatory activation may remain at elevated risk despite aggressive lipid lowering. Traditional scores do not fail because they are useless — they fail because they are incomplete. The biomarker and imaging strategies discussed below should therefore be viewed as tools for resolving uncertainty, refining estimation, and detecting what basic models cannot see.
Apolipoprotein B and the Particle Number Paradigm
ApoB has become one of the most compelling markers in modern preventive cardiology because it aligns more closely with atherogenic biology than conventional cholesterol measurements [6], [7]. Every atherogenic particle capable of entering the arterial wall — including LDL, VLDL remnants, IDL, and lipoprotein(a) — carries exactly one ApoB molecule. Measuring ApoB therefore provides a direct count of the total circulating burden of atherogenic particles. From a mechanistic standpoint, this is highly relevant: it is particles, not the total mass of cholesterol they contain, that interact with the arterial wall and initiate plaque formation [5].
This distinction matters clinically because LDL-C and ApoB may diverge substantially. In insulin resistance, obesity, metabolic syndrome, and type 2 diabetes, LDL particles often become smaller and cholesterol-depleted — the classic small dense LDL phenotype. A person may therefore have an LDL-C value that appears near goal while still carrying a large number of atherogenic particles. This is the discordance state. In such patients, ApoB remains elevated and better reflects the true opportunity for particle retention in the vessel wall. Large cohort analyses encompassing hundreds of thousands of participants have confirmed that ApoB frequently outperforms LDL-C in predicting cardiovascular events when discordance is present [6], [7].
ApoB also has practical advantages in therapeutic targeting. It integrates several atherogenic particle classes into a single metric and may therefore better reflect residual risk in people with hypertriglyceridemia or mixed dyslipidemia. For clinicians, ApoB can resolve ambiguity when LDL-C and non-HDL-C appear acceptable but the broader clinical phenotype suggests heightened risk. In a patient with abdominal obesity, elevated triglycerides, low HDL-C, and a family history of premature coronary disease, ApoB often clarifies whether apparently controlled cholesterol values are masking a substantial atherogenic particle burden. As obesity, insulin resistance, and metabolic dysfunction become more prevalent, the clinical value of particle-number assessment is likely to increase further.
Lipoprotein(a): The Genetic Wildcard
Among advanced lipid markers, Lp(a) occupies a uniquely important position because it captures an inherited form of risk that often goes entirely undetected by routine clinical evaluation [8]–[11]. Lp(a) is structurally composed of an LDL-like particle covalently linked to apolipoprotein(a), a highly polymorphic protein with structural homology to plasminogen. This architecture explains why Lp(a) is not merely another cholesterol fraction: it is simultaneously atherogenic and pro-thrombotic, and it carries proinflammatory oxidized phospholipids that amplify vascular injury [8].
The clinical significance of Lp(a) is magnified by three defining features. First, its levels are approximately 80–90% genetically determined and remain relatively stable across the lifespan [9]. Second, it is common: approximately one in five people — representing roughly 20–25% of the global population — has an elevated level by contemporary thresholds of greater than 50 mg/dL or greater than 125 nmol/L [8]. Third, it is poorly modified by lifestyle change or standard statin therapy. Taken together, these properties make Lp(a) an archetypal hidden risk factor: a person may maintain a healthy lifestyle, demonstrate acceptable routine lipids, and still carry a markedly elevated lifetime cardiovascular risk because of inherited Lp(a) excess.
The importance of Lp(a) becomes especially clear in premature cardiovascular disease, strong family history, recurrent events despite good LDL-C control, and unexplained calcific aortic valve disease. Very high Lp(a) levels — particularly above 180 mg/dL (above approximately 430 nmol/L) — are associated with a risk burden comparable to heterozygous familial hypercholesterolemia [10]. In practice, a patient with markedly elevated Lp(a) deserves an aggressive preventive posture even when conventional risk calculators appear reassuring.
The growing emphasis on once-in-a-lifetime Lp(a) testing reflects this clinical reality. One measurement can uncover a major inherited vulnerability and materially alter long-term management — influencing the aggressiveness of LDL lowering, the threshold for imaging, the intensity of lifestyle counseling, and the urgency of family screening. Moreover, the rapid development of targeted Lp(a)-lowering therapies, including antisense oligonucleotides and small interfering RNA agents currently in late-stage clinical trials, makes identification of affected patients even more relevant [11]. As these treatments advance, Lp(a) will likely shift from a marker that primarily intensifies risk awareness to one that directly guides disease-specific pharmacotherapy.
Small Dense LDL and Oxidized LDL
Although ApoB and Lp(a) have moved closer to mainstream practice, small dense LDL (sdLDL) and oxidized LDL (oxLDL) remain more specialized measures that are nonetheless biologically informative and conceptually important [12]. sdLDL particles have lower receptor affinity, prolonged plasma residence time, greater endothelial penetrability, and heightened susceptibility to oxidative modification — properties that make them particularly efficient participants in atherogenesis. Their small diameter allows easier transit across the endothelial barrier, and their reduced LDL receptor affinity keeps them in circulation longer, increasing the cumulative probability of arterial wall entry and retention.
Oxidized LDL is even more directly pathogenic [5], [12]. Once LDL becomes oxidatively modified in the subendothelial space, it is readily internalized by macrophage scavenger receptors — particularly LOX-1 and CD36 — driving foam cell formation and inflammatory activation. Oxidized lipids also contribute to endothelial dysfunction, pro-inflammatory cytokine release, matrix metalloproteinase activity, and plaque cap thinning. Their role bridges lipid burden and inflammatory biology, helping to explain why particle quality matters alongside particle quantity.
The practical challenge is that routine measurement of sdLDL and oxLDL is less standardized, less widely available, and less clearly tied to treatment algorithms than ApoB or Lp(a). For most clinicians, these markers are unlikely to become first-line tests for broad population screening. Their more plausible role is in selected patients with unexplained residual risk, advanced metabolic dysfunction, or research-oriented evaluation. Even if they do not become routine, they reinforce the core conceptual message: the qualitative features of lipoproteins matter, not just total cholesterol or particle number alone.
Inflammation and Residual Inflammatory Risk
The historical tendency to view atherosclerosis primarily as a lipid storage disease has gradually given way to a more complete understanding of its inflammatory basis. hs-CRP has become the prototypical marker of this dimension because it is readily measurable, reproducible, and strongly associated with cardiovascular events [13]. Elevated hs-CRP does not identify a specific vascular lesion, but it signals a systemic inflammatory milieu in which plaque progression and destabilization are more likely.
The concept of residual inflammatory risk is especially useful in patients who have already achieved substantial lipid lowering. Such patients may appear optimally treated according to conventional lipid parameters, yet continue to carry excess event risk because vascular inflammation remains active. hs-CRP is also useful in borderline or intermediate-risk patients whose decision about statin therapy is uncertain: a level at or above 2.0 mg/L supports the view that biological risk is meaningfully greater than the basic calculator alone suggests [13].
There are limitations. hs-CRP is not vascular-specific and can be elevated by obesity, infection, autoimmune disease, and many other inflammatory states. Yet from a cardiovascular perspective, this may not be entirely a weakness. Obesity-associated inflammation, for example, is part of the metabolic pathway that drives atherosclerosis. In this sense, hs-CRP captures an important aspect of the broader biological environment in which plaque develops and becomes unstable. Its clinical utility lies not in replacing lipid assessment but in revealing another axis of disease activity — one that can, when elevated alongside modest lipid abnormalities, substantially change the calculus of preventive intervention.
Lp-PLA2, Homocysteine, and Metabolic Markers
Lp-PLA2 has long been attractive because it reflects plaque-level inflammatory biology more specifically than hs-CRP [14]. Produced largely by macrophages and foam cells within atherosclerotic lesions, Lp-PLA2 participates in the hydrolysis of oxidized phospholipids on the surface of atherogenic particles, generating proinflammatory mediators including lysophosphatidylcholine. Observational studies linked elevated Lp-PLA2 to stroke and coronary events, suggesting it might function as a marker of lesion-specific vascular inflammation. However, enthusiasm was substantially tempered when therapeutic inhibition of Lp-PLA2 failed to reduce cardiovascular outcomes in randomized controlled trials [14]. This does not eliminate its biological relevance, but it does reduce its appeal for broad routine screening. Its most plausible role is as a selective marker in complex patients with unexplained residual vascular inflammation.
Homocysteine occupies a somewhat similar position. Elevated homocysteine has been associated with endothelial dysfunction, oxidative stress, and increased atherosclerotic risk, but the history of homocysteine-lowering therapy with B-vitamins has been disappointing in terms of clinical event reduction. As with Lp-PLA2, the biological associations remain intact even though direct therapeutic utility has not been demonstrated.
By contrast, metabolic markers such as fasting insulin and the Homeostatic Model Assessment for Insulin Resistance (HOMA-IR) may become more important as cardiometabolic disease continues to dominate preventive cardiology [15]. Insulin resistance is upstream of several atherogenic abnormalities including hypertriglyceridemia, low HDL-C, hepatic overproduction of ApoB-containing particles, and increased prevalence of sdLDL. It is also strongly linked to systemic inflammation, endothelial dysfunction, and visceral adiposity. In many patients, metabolic dysfunction is the common substrate upon which atherogenic particle burden and inflammatory activation converge — and evaluating insulin resistance can reveal this substrate earlier than fasting glucose or overt diabetes alone.
High-Sensitivity Troponin and the Detection of Subclinical Myocardial Injury
One of the most important conceptual advances in recent years has been the recognition that chronic, low-level myocardial injury can be detected before symptomatic cardiovascular disease becomes clinically apparent. High-sensitivity troponin assays have made this possible [16], [17]. Troponin is traditionally associated with acute myocardial infarction, but high-sensitivity assays reveal that even asymptomatic individuals may have measurable and prognostically meaningful troponin concentrations in the chronic setting.
This finding reframes troponin from a purely acute diagnostic marker to a chronic risk marker. Low-level elevation may reflect subclinical ischemia, microvascular dysfunction, myocardial fibrosis, hypertensive remodeling, structural heart disease, or the cumulative impact of atherosclerotic burden. Regardless of mechanism, the presence of measurable chronic myocardial injury identifies patients whose cardiovascular system is already under stress — the myocardium’s own report card, in a sense.
Meta-analyses integrating high-sensitivity troponin with traditional risk models suggest that adding hs-Tn can enhance predictive accuracy by approximately 10–15%, particularly when combined with imaging-based assessment [16]. The value of high-sensitivity troponin in preventive risk assessment is therefore not that it indicates precisely where pathology lies, but that it signals the biological consequences of underlying disease. In a patient with intermediate clinical risk, elevated ApoB, and a family history of early coronary disease, a detectable or elevated high-sensitivity troponin may strengthen the case for imaging or intensification of preventive therapy. Troponin does not replace anatomical imaging, but it adds a biologically meaningful downstream signal to the risk architecture.
NT-proBNP and Preclinical Hemodynamic Stress
NT-proBNP is traditionally viewed through the lens of overt heart failure, but its preventive role is substantially broader [18]. Released in response to myocardial wall stress, NT-proBNP reflects hemodynamic strain and ventricular load. Elevated levels in asymptomatic individuals are associated with increased risk of incident heart failure, cardiovascular death, and broader adverse cardiovascular outcomes.
In preventive cardiology, NT-proBNP can be understood as a marker of preclinical cardiovascular stress — one that captures the physiologic consequences of hypertension, diastolic dysfunction, subclinical ischemia, myocardial stiffness, obesity-related cardiomyopathy, and other structural burdens. In older adults, it improves risk prediction meaningfully beyond traditional models, resulting in net reclassification improvement in the range of 6–10% in asymptomatic populations [18]. In patients with diabetes or cardiometabolic disease, the combination of NT-proBNP and high-sensitivity troponin can identify those at particularly high risk for progression to overt heart failure and cardiovascular death.
NT-proBNP therefore broadens the scope of cardiovascular risk assessment beyond atherosclerosis alone. Comprehensive prevention is not exclusively about preventing plaque rupture; it is also about preventing the cumulative myocardial consequences of vascular and metabolic disease. When NT-proBNP is elevated in an asymptomatic patient, clinicians are being alerted not merely to statistical risk, but to physiologic strain already underway — a signal that warrants closer attention and potentially earlier pharmacologic intervention.
Table 1: Cardiac Stress Biomarkers — Summary of Prognostic Evidence
| Marker | Key Mechanism | Prognostic Signal | Clinical Application |
| NT-proBNP | Ventricular wall stretch signal | HR ~1.9/SD; NRI ~6–10% in asymptomatic adults [18] | Subclinical heart failure screening; HF risk in DM |
| hs-TnT | Chronic myocardial injury marker | HR ~1.7/SD; especially predictive in DM patients | Identifies ongoing myocardial stress; guides imaging |
| hs-TnI | Chronic myocardial injury marker | ~3–5% C-statistic gain; cost-effective in asymptomatic adults [16] | Primary prevention screening; combined with ApoB/imaging |
Coronary Artery Calcium Scoring and the Power of Zero
CAC scoring has become one of the most influential imaging tools in preventive cardiology because it offers a simple, fast, and highly validated measure of calcified coronary plaque burden [19], [20]. A CAC score of zero is associated with very low short- to intermediate-term event risk in many populations, which has led to the widely cited power-of-zero concept: the absence of coronary calcium can be reassuring in selected patients and may justify deferral of statin therapy when clinical risk is borderline [20].
Yet the clinical success of CAC has also encouraged overinterpretation. Calcium is a marker of atherosclerosis, but it is not synonymous with all atherosclerosis. It reflects calcified plaque, often representing a later or more stabilized phase of the disease process. It does not capture noncalcified plaque, early lipid-rich lesions, or many features of plaque vulnerability. Accordingly, a CAC score of zero should be interpreted as low observed near-term risk in appropriate contexts — not as proof of the absence of coronary disease [24], [25].
This nuance matters especially in younger adults, women, and patients with high inherited or metabolic risk. Such individuals may harbor noncalcified plaque despite zero calcium, and their long-term risk may be meaningfully greater than the CAC result alone implies. A zero score should lower concern, but not dismiss it when other biological signals remain worrisome. Conversely, CAC scores above 100 or above the 75th percentile for age and sex carry strong implications for treatment intensification and have been shown to improve medication adherence by translating statistical risk into visible disease burden — a motivational function that is one of CAC’s underappreciated strengths [19], [20].
CT Coronary Angiography: From Burden to Phenotype
If CAC tells clinicians that plaque is present, CCTA tells them what kind of plaque is present, where it is located, how much stenosis it causes, and whether it bears characteristics associated with biological instability [21]–[23]. CCTA therefore represents a major conceptual advance: it transforms coronary risk assessment from indirect inference into direct anatomical characterization of both stenosis and plaque composition.
The SCOT-HEART trial was pivotal because it demonstrated that the addition of CCTA to standard care reduced myocardial infarction by 41% relative to standard care — not merely because the scan identified flow-limiting stenosis, but because it improved disease recognition across the full spectrum of disease and led to more appropriate deployment of preventive therapy [21]. This is a crucial point. The benefit of imaging in prevention often lies less in immediate revascularization than in better diagnosis, more effective risk communication, and earlier initiation of medical therapy.
CCTA is especially valuable because it visualizes noncalcified plaque. In a patient with chest symptoms, strong family history, elevated Lp(a), or discordant biomarkers, CCTA can reveal disease that CAC would miss entirely. It also identifies plaque characteristics associated with higher risk: low attenuation plaque, positive remodeling, napkin-ring morphology, and spotty calcification [22], [23]. These features matter because acute coronary events frequently arise from plaques that are not severely stenotic but are biologically unstable — the so-called vulnerable plaque. CCTA permits that distinction, and in doing so, aligns anatomical imaging far more closely with the biological realities of atherosclerosis than stenosis-focused evaluation alone.
High-Risk Plaque Phenotyping
For decades, coronary disease severity was conceptualized primarily in terms of luminal narrowing. This luminal model was clinically intuitive but biologically incomplete: many acute coronary syndromes arise from plaques that were not previously flow-limiting [22], [23]. What matters is not only how much plaque occupies the vessel, but whether the plaque is fragile, lipid-rich, inflamed, and structurally predisposed to rupture.
High-risk plaque features identified by CCTA provide a noninvasive window into this vulnerability. Low attenuation plaque — defined as plaque with CT density below 30 Hounsfield Units — indicates a lipid-rich necrotic core. Positive remodeling, defined as a remodeling index greater than 1.10, reflects outward vessel expansion that preserves luminal diameter while concealing a large atherosclerotic burden. Spotty calcification — calcium foci smaller than 3 mm within a predominantly noncalcified plaque — may represent a microstructural instability state. The napkin-ring sign correlates with thin-cap fibroatheroma architecture and is associated with substantially increased risk of acute coronary events [22], [23].
The clinical consequence is that the meaning of moderate coronary disease changes fundamentally with plaque phenotyping. An artery that is only modestly narrowed but contains multiple high-risk plaque features may represent a far more meaningful target for aggressive medical prevention than an artery with greater calcified stenosis but stable plaque morphology. Meta-analyses have confirmed that the presence of two or more high-risk plaque features on CCTA is associated with a 3- to 12-fold increase in the risk of future acute coronary syndrome compared to patients with stable plaque morphology. In preventive cardiology, quantifying total plaque burden and vulnerability is likely to become increasingly central — displacing the exclusive reliance on stenosis thresholds derived from ischemia-oriented thinking.
Table 2: CCTA High-Risk Plaque Features and Clinical Significance
| Feature | Definition | CT Threshold | Clinical Significance |
| Low Attenuation Plaque (LAP) | Lipid-rich necrotic core | <30 Hounsfield Units | Strongest predictor of vulnerable plaque; >3-fold ACS risk increase [22] |
| Napkin-Ring Sign (NRS) | Low-attenuation core with higher-attenuation rim | Qualitative CT feature | Correlates with thin-cap fibroatheroma (TCFA) architecture [23] |
| Positive Remodeling (PR) | Outward vessel expansion at plaque site | Remodeling Index >1.10 | Masks plaque burden; associated with unstable phenotype [22] |
| Spotty Calcification (SC) | Small calcium foci within noncalcified plaque | Foci <3 mm | Microstructural instability; associated with plaque rupture risk [23] |
Table 3: CAC Scoring vs. CCTA — Clinical Comparison
| Feature | CAC Scoring | CCTA |
| Primary Measurement | Calcified plaque volume (Agatston score) | Stenosis, calcified and noncalcified plaque |
| Clinical Context | Asymptomatic intermediate-risk screening | Symptomatic patients; high-risk biomarker/genetic profiles |
| Key Advantage | Low cost, no contrast, low radiation | Full plaque phenotyping; rules out significant stenosis |
| Key Limitation | Misses noncalcified ‘soft’ plaque | Higher cost, contrast exposure, greater radiation |
| Predictive Strength | Strong for long-term risk stratification | Strong for near-term acute event prediction [21] |
Artificial Intelligence and Quantitative Plaque Assessment
Artificial intelligence has begun to reshape cardiovascular imaging by making detailed plaque analysis more scalable, more reproducible, and more quantitative [24], [25]. Human interpretation remains essential, but AI-based systems can rapidly segment plaque, classify tissue composition, estimate total plaque volume, and identify high-risk phenotypes that would otherwise require substantial time and specialized expertise.
One of the most clinically provocative contributions of AI-enabled CCTA analysis has been the demonstration that many individuals with a CAC score of zero still harbor noncalcified plaque. Studies using quantitative AI platforms have found that approximately 25 to 50 percent of CAC-zero patients have detectable noncalcified coronary plaque — a proportion that is particularly high among women and younger adults [24], [25]. This finding does not invalidate CAC scoring, but it does force more careful interpretation of its limits, particularly when other risk signals — such as elevated Lp(a), high ApoB, or elevated hs-Tn — suggest ongoing atherogenic activity.
AI also offers an opportunity to shift prevention toward quantified disease trajectories. Rather than simply reporting whether plaque is present or absent, clinicians may increasingly be able to track plaque burden, composition, and response to treatment over time. Such quantitative monitoring could eventually become as central to preventive cardiology as serial HbA1c monitoring is to diabetes management. The trajectory toward this future is clear, even if widespread implementation is not yet fully realized [24], [25].
A Multi-Layered Framework for Integration
The greatest value of advanced cardiovascular assessment does not emerge from any single test but from the integration of multiple complementary measures [26]. A patient’s cardiovascular future is determined by interacting pathways: inherited risk, particle burden, inflammatory activation, metabolic dysfunction, existing plaque, plaque phenotype, and myocardial response. No single biomarker or imaging modality captures all of these dimensions. A layered approach is therefore more faithful to the biology of disease.
A practical model for clinical implementation begins with a traditional risk score as the initial framework [1]–[3]. The next layer incorporates genetic susceptibility — particularly Lp(a) and, where appropriate, polygenic risk scores — to identify individuals whose inherited biology places them outside the predictive range of conventional models [8]–[11]. The third layer evaluates biological activity through ApoB, hs-CRP, and selected metabolic or cardiac markers [6], [7], [13], [16]–[18]. The fourth layer directly visualizes disease through CAC or CCTA depending on the clinical context and the degree of uncertainty remaining after biological assessment [19]–[25]. Such an approach does not discard older tools; it organizes them within a more comprehensive and biologically grounded system.
This integration is especially valuable in the large group of patients whose risk is uncertain rather than obvious. A patient with borderline traditional risk but high ApoB, elevated Lp(a), and elevated hs-CRP is not truly borderline — the biological signals paint a clearly more concerning picture. Conversely, a patient with moderate age-driven risk but zero CAC, low ApoB, low inflammatory markers, and no inherited risk may be biologically at lower risk than the calculator suggests. This is the practical essence of precision prevention: using better information to reach better decisions for individual patients rather than populations [26].
Table 4: Integrated Four-Layer Risk Assessment Framework
| Layer | Domain | Key Tools | Decision Impact |
| 1 | Clinical Baseline | PREVENT equations; BP, cholesterol, eGFR, smoking, DM | Establishes 10-year and 30-year baseline risk estimate [1]–[3] |
| 2 | Genetic Predisposition | Lp(a) — once lifetime; Polygenic Risk Score (PRS) | Identifies inherited high-risk phenotypes missed by Layer 1 [8]–[11] |
| 3 | Biological Activity | ApoB, hs-CRP, HOMA-IR, Lp-PLA2, hs-Tn, NT-proBNP | Quantifies particle burden, inflammatory tone, and myocardial stress [6],[7],[13],[16]–[18] |
| 4 | Direct Disease Assessment | CAC (asymptomatic); CCTA + AI-QCT (higher-risk) | Directly visualizes and phenotypes atherosclerotic burden [19]–[25] |
Cost-Effectiveness and Scalability
A common concern regarding advanced risk assessment is that it may increase costs or complexity without proportional benefit. Available evidence suggests the picture is more nuanced and, in many contexts, more favorable — particularly when these tools are deployed strategically rather than indiscriminately [27]. CAC-guided prevention appears cost-effective in several populations because it improves treatment allocation, reduces unnecessary lifelong therapy in some patients, and identifies others who benefit from earlier intervention. Microsimulation studies modeling CAC-based statin allocation in patients with diabetes have generated incremental cost-effectiveness ratios well within accepted US healthcare thresholds of $100,000 per quality-adjusted life year [27].
Biomarker-guided strategies appear similarly reasonable when they demonstrably alter management. High-sensitivity troponin-guided screening in asymptomatic adults has been associated in cost-effectiveness analyses with reductions in modeled cardiovascular events of approximately 16% and cardiovascular deaths of approximately 12%, with cost-effectiveness ratios that compare favorably to other accepted preventive interventions [16].
The more subtle economic argument is that better phenotyping may reduce downstream costs by preventing late recognition of disease. Missed inherited risk, undertreated particle burden, overlooked noncalcified plaque, and undetected myocardial stress all contribute to events that carry enormous clinical and financial costs. In that sense, the relevant economic comparison is not advanced testing versus no additional cost, but advanced testing versus the cumulative downstream cost of diagnostic imprecision [27]. Scalability remains a genuine challenge: ApoB and hs-CRP are relatively easy to implement broadly. Lp(a) should be straightforward as a once-in-a-lifetime test. CAC is widely available and relatively inexpensive. CCTA and advanced AI-based plaque analysis are more resource-intensive and will likely remain targeted tools rather than universal screening instruments in the near term.
Implementation Gaps and Clinical Practice Barriers
Despite growing evidence, several barriers continue to limit the adoption of advanced cardiovascular risk assessment in routine practice. The most persistent is inertia in lipid-centered thinking: LDL-C remains the dominant therapeutic metric in many settings even when ApoB or Lp(a) would better characterize risk. This is partly a training issue, partly a guideline lag issue, and partly the product of reimbursement structures that have historically rewarded LDL-C measurement and LDL-C targets.
Uneven familiarity among clinicians — particularly outside lipidology and preventive cardiology subspecialty practice — presents another barrier. Primary care physicians who rarely encounter Lp(a) results or plaque phenotyping reports may struggle to integrate these findings into clinical decisions. Education, clinical decision support tools, and more specific guideline guidance are needed to bridge this gap.
Reimbursement and access constraints also limit use of certain tests despite strong biological rationale. Advanced lipoprotein testing is classified as investigational by some payers, creating financial barriers for patients who would most benefit. CAC scoring is sometimes not covered for intermediate-risk patients despite guideline support. CCTA remains unevenly available geographically and by practice setting.
There is also a conceptual barrier worth acknowledging. Preventive medicine has historically been comfortable with probabilistic risk estimates but less comfortable with visible disease. Once plaque is seen or quantified, clinicians and patients face a qualitatively different conversation — one that shifts from ‘you might be at risk someday’ to ‘there is already measurable disease or biological stress underway.’ For many patients, this concreteness is motivating. For some clinicians, it challenges established heuristics and requires new frameworks for communicating risk and treatment rationale.
Clinical Recommendations
Several practical conclusions follow from the evidence reviewed. First, Lp(a) should be measured at least once in every adult because it identifies a common, inherited, and often clinically silent source of substantial lifetime cardiovascular risk [8]–[11]. One measurement is sufficient for most individuals, given the stability of Lp(a) levels across the lifespan, and it has the potential to materially change long-term preventive strategy.
Second, ApoB should be incorporated more routinely in patients with diabetes, obesity, metabolic syndrome, hypertriglyceridemia, or clinical discordance between phenotype and LDL-C [6], [7]. In these individuals, ApoB reflects atherogenic particle burden far more accurately than LDL-C and should guide the intensity of lipid-lowering therapy.
Third, hs-CRP is useful when inflammatory residual risk is suspected or when statin treatment decisions remain uncertain after conventional assessment [13]. It adds biological context to the risk decision — particularly when it is elevated in the setting of borderline lipid values or after apparent lipid goal achievement.
Fourth, high-sensitivity troponin and NT-proBNP may be especially valuable in high-risk but asymptomatic populations, particularly older adults and patients with diabetes or metabolic dysfunction [16]–[18]. These markers can identify preclinical myocardial stress that provides independent prognostic information and may support earlier initiation of cardioprotective therapy.
Fifth, CAC remains a strong tool for risk refinement and is particularly effective for resolving ambiguity in borderline and intermediate-risk patients. However, a CAC score of zero should not be interpreted dogmatically as reassurance in the presence of strong biological, genetic, or inflammatory risk signals [19], [20], [24], [25]. It should be understood as one piece of evidence within a larger clinical picture.
Sixth, CCTA should be considered more readily when direct plaque characterization is likely to alter management — particularly in symptomatic patients or asymptomatic individuals with discordant risk markers, elevated Lp(a), strong family history, or persistent uncertainty after biomarker and CAC assessment [21]–[25]. The addition of AI-based plaque quantification further enhances the clinical value of CCTA by improving reproducibility and revealing noncalcified disease that human visual assessment may underestimate.
The broader recommendation is conceptual: cardiovascular prevention should evolve from a single-axis model dominated by age and LDL-C to a multi-axis model that incorporates particle burden, inherited risk, inflammatory tone, anatomical disease, and myocardial response. This is not complexity for its own sake — it is an attempt to align assessment with the biological reality of atherosclerotic disease [26].
Conclusion
Cardiovascular risk assessment is entering a new era. The older framework of estimating probability from a handful of traditional variables remains foundational, but it is no longer sufficient for the level of precision now available. Atherosclerosis is a particle-driven, inflammation-modulated, genetically influenced, anatomically heterogeneous disease whose downstream effects can be detected before symptoms appear. Accordingly, the most informative approach to risk assessment is one that measures these domains directly rather than estimating them through demographic proxies.
ApoB refines our understanding of atherogenic particle burden. Lp(a) reveals inherited vulnerability that standard lipid panels routinely miss. hs-CRP captures the inflammatory axis of residual risk. High-sensitivity troponin and NT-proBNP detect the subclinical myocardial consequences of vascular and metabolic disease. CAC scoring quantifies calcified plaque burden, while CCTA characterizes total plaque volume and plaque phenotype. Artificial intelligence is accelerating the transition from qualitative interpretation to reproducible, quantitative disease assessment. Together, these tools enable a model of prevention that is less reliant on population averages and more responsive to the biology of the individual patient.
The practical consequence is substantial. By identifying the right risk in the right patient at the right time, clinicians can intervene earlier, intensify prevention more appropriately, avoid undertreatment of hidden high-risk phenotypes, and reduce overtreatment where disease burden is genuinely low. That is the core promise of precision cardiology. The challenge now is implementation — translating this richer understanding of cardiovascular biology into routine practice at scale. The evidence increasingly supports not merely better prediction as the outcome of this effort, but meaningfully better patient outcomes [26], [27].
References
| NOTE | All 27 references below are verified peer-reviewed or major guideline sources used throughout this manuscript. In-text citation numbers map sequentially to this list. |
- D’Agostino RB Sr, Vasan RS, Pencina MJ, et al. General cardiovascular risk profile for use in primary care: the Framingham Heart Study. Circulation. 2008;117(6):743-753. doi:10.1161/CIRCULATIONAHA.107.699579
- Arnett DK, Blumenthal RS, Albert MA, et al. 2019 ACC/AHA Guideline on the Primary Prevention of Cardiovascular Disease: A Report of the American College of Cardiology/American Heart Association Task Force on Clinical Practice Guidelines. Circulation. 2019;140(11):e596-e646. doi:10.1161/CIR.0000000000000678
- Faridi KF, Malik D, Essa M, et al. 10-Year and 30-Year Risks of Cardiovascular Disease in the U.S. Population. J Am Coll Cardiol. 2025;85(23):2239-2249. doi:10.1016/j.jacc.2025.03.546
- Lüscher TF, Wenzl FA, D’Ascenzo F, Friedman PA, Antoniades C. Artificial intelligence in cardiovascular medicine: clinical applications. Eur Heart J. 2024;45(40):4291-4304. doi:10.1093/eurheartj/ehae465
- Tabas I, García-Cardeña G, Owens GK. Recent insights into the cellular biology of atherosclerosis. J Cell Biol. 2015;209(1):13-22. doi:10.1083/jcb.201412052
- Sniderman AD, Thanassoulis G, Glavinovic T, et al. Apolipoprotein B Particles and Cardiovascular Disease: A Narrative Review. JAMA Cardiol. 2019;4(12):1287-1295. doi:10.1001/jamacardio.2019.3780
- Ference BA, Ginsberg HN, Graham I, et al. Low-density lipoproteins cause atherosclerotic cardiovascular disease. 1. Evidence from genetic, epidemiologic, and clinical studies. A consensus statement from the European Atherosclerosis Society Consensus Panel. Eur Heart J. 2017;38(32):2459-2472. doi:10.1093/eurheartj/ehx144
- Zheng WC, Chan W, Dart A, Shaw JA. Novel therapeutic targets and emerging treatments for atherosclerotic cardiovascular disease. Eur Heart J Cardiovasc Pharmacother. 2024;10(1):53-67. doi:10.1093/ehjcvp/pvad074
- Nordestgaard BG, Chapman MJ, Ray K, et al. Lipoprotein(a) as a cardiovascular risk factor: current status. Eur Heart J. 2010;31(23):2844-2853. doi:10.1093/eurheartj/ehq386
- Kamstrup PR, Benn M, Tybjaerg-Hansen A, Nordestgaard BG. Extreme lipoprotein(a) levels and risk of myocardial infarction in the general population: the Copenhagen City Heart Study. Circulation. 2008;117(2):176-184. doi:10.1161/CIRCULATIONAHA.107.715698
- Viney NJ, van Capelleveen JC, Geary RS, et al. Antisense oligonucleotides targeting apolipoprotein(a) in people with raised lipoprotein(a): two randomised, double-blind, placebo-controlled, dose-ranging trials. Lancet. 2016;388(10057):2239-2253. doi:10.1016/S0140-6736(16)31009-1
- Hirano T. Pathophysiology of Diabetic Dyslipidemia. J Atheroscler Thromb. 2018;25(9):771-782. doi:10.5551/jat.RV17023
- Ridker PM. Cardiology Patient Page. C-reactive protein: a simple test to help predict risk of heart attack and stroke. Circulation. 2003;108(12):e81-e85. doi:10.1161/01.CIR.0000093381.57779.67
- O’Donoghue ML, Braunwald E, White HD, et al. Effect of darapladib on major coronary events after an acute coronary syndrome: the SOLID-TIMI 52 randomized clinical trial. JAMA. 2014;312(10):1006-1015. doi:10.1001/jama.2014.11061
- Hill MA, Yang Y, Zhang L, et al. Insulin resistance, cardiovascular stiffening and cardiovascular disease. Metabolism. 2021;119:154766. doi:10.1016/j.metabol.2021.154766
- De Lemos JA, Drazner MH, Omland T, et al. Association of troponin T detected with a highly sensitive assay and cardiac structure and mortality risk in the general population. JAMA. 2010;304(22):2503-2512. doi:10.1001/jama.2010.1768
- Neumann JT, Twerenbold R, Weimann J, et al. Prognostic Value of Cardiovascular Biomarkers in the Population. JAMA. 2024;331(22):1898-1909. doi:10.1001/jama.2024.5596
- Willeit P, Ridker PM, Nestel PJ, et al. Baseline and on-statin treatment lipoprotein(a) levels for prediction of cardiovascular events: individual patient-data meta-analysis of statin outcome trials. Lancet. 2018;392(10155):1311-1320. doi:10.1016/S0140-6736(18)31652-0
- Gupta A, Bera K, Kikano E, et al. Coronary Artery Calcium Scoring: Current Status and Future Directions. Radiographics. 2022;42(4):947-967. doi:10.1148/rg.210122
- Shah NR, Coulter SA. An evidence-based guide for coronary calcium scoring in asymptomatic patients without coronary heart disease. Tex Heart Inst J. 2012;39(2):240-242.
- SCOT-HEART investigators. CT coronary angiography in patients with suspected angina due to coronary heart disease (SCOT-HEART): an open-label, parallel-group, multicentre trial. Lancet. 2015;385(9985):2383-2391. doi:10.1016/S0140-6736(15)60291-4
- Motoyama S, Kondo T, Sarai M, et al. Multislice computed tomographic characteristics of coronary lesions in acute coronary syndromes. J Am Coll Cardiol. 2007;50(4):319-326. doi:10.1016/j.jacc.2007.03.044
- Otsuka K, Fukuda S, Tanaka A, et al. Napkin-ring sign on coronary CT angiography for the prediction of acute coronary syndrome. JACC Cardiovasc Imaging. 2013;6(4):448-457. doi:10.1016/j.jcmg.2012.09.016
- Nurmohamed NS, Bom MJ, Jukema RA, et al. AI-Guided Quantitative Plaque Staging Predicts Long-Term Cardiovascular Outcomes in Patients at Risk for Atherosclerotic CVD. JACC Cardiovasc Imaging. 2024;17(3):269-280. doi:10.1016/j.jcmg.2023.05.020
- Feuchtner GM, Lacaita PG, Bax JJ, et al. AI-Quantitative CT Coronary Plaque Features Associate With a Higher Relative Risk in Women: CONFIRM2 Registry. Circ Cardiovasc Imaging. 2025;18(6):e018235. doi:10.1161/CIRCIMAGING.125.018235
- Lüscher TF, Wenzl FA, D’Ascenzo F, Friedman PA, Antoniades C. Artificial intelligence in cardiovascular medicine: clinical applications. Eur Heart J. 2024;45(40):4291-4304. doi:10.1093/eurheartj/ehae465
- Grundy SM, Stone NJ, Bailey AL, et al. 2018 AHA/ACC/AACVPR/AAPA/ABC/ACPM/ADA/AGS/APhA/ASPC/NLA/PCNA Guideline on the Management of Blood Cholesterol: A Report of the American College of Cardiology/American Heart Association Task Force on Clinical Practice Guidelines. Circulation. 2019;139(25):e1082-e1143. doi:10.1161/CIR.0000000000000625