
Why Everything You Knew About Cholesterol Is Changing: 5 Lessons for a Longer Life
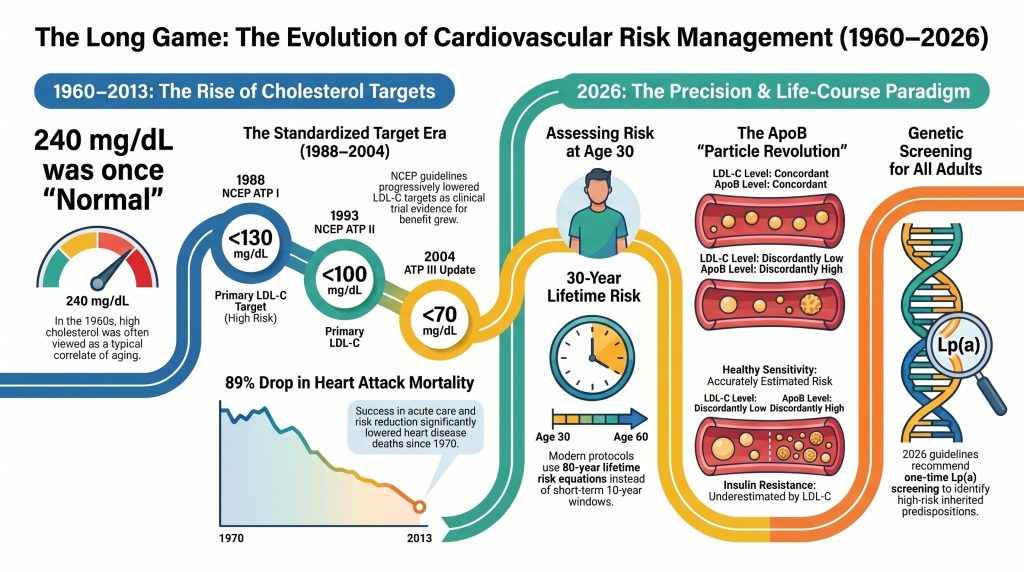
For decades, we have been told that a “normal” cholesterol level is the golden ticket to a healthy heart. But modern science has revealed a startling truth: what we once called “normal” was never actually healthy. In the 1960s, a total cholesterol level of 240 mg/dL was considered a standard, acceptable baseline for an adult. Today, a doctor would view that same number as an urgent health crisis.
Think of it like car safety standards. In the 1960s, a vehicle without seatbelts, airbags, or crumple zones was the population “average.” It met the safety standards of the time, yet those cars were significantly more dangerous than anything on the road today. During the famous “Cholesterol Controversy” of the mid-20th century, researchers debated whether blood lipids were actually causing heart disease or were just a side effect of getting older. We now know the answer: they are the primary drivers.
The problem was that we were measuring health based on a “sick population baseline.” Because nearly everyone in Western society was already on the path toward heart disease, our “average” was actually a recipe for disaster. As we move into the 2026 medical paradigm, we are shifting from reactive crisis management to proactive, lifelong prevention.
Here are five lessons from the front lines of modern lipidology that are changing how we live for a longer, healthier life.
Lesson 1: Your “Normal” Might Still Be Too High (The Tsimane Secret)
To find the true blueprint for human heart health, scientists looked away from modern cities and toward the Bolivian Amazon. There, they studied the Tsimane people, an indigenous group with the lowest rates of heart disease ever recorded.
The Tsimane provide a fascinating biological lesson. Even though they live in an environment with high levels of systemic inflammation—largely due to a heavy burden of pathogens and parasites—they almost never develop atherosclerosis (clogged arteries). The reason lies in their lifetime exposure to incredibly low cholesterol. Their average LDL (the “bad” cholesterol) is roughly 91 mg/dL, and their mean HDL is 39.5 mg/dL.
Because their levels stay at these low levels from birth until old age, their arteries never reach the critical threshold required for plaque to build up.
“An 80-year-old Tsimane has an arterial age equivalent to a 50-year-old American.”
This proves that heart disease is not an inevitable consequence of aging. If we can keep our lipid levels low enough for long enough, we can effectively “age-proof” our cardiovascular system.
Lesson 2: Stop Counting the Weight, Start Counting the “Ships” (The ApoB Revolution)
For years, the standard lab test has been LDL-C, which measures the total weight of cholesterol in your blood. However, the 2026 guidelines have shifted the focus toward Apolipoprotein B (ApoB).
To understand why, imagine your bloodstream is a vast ocean and cholesterol is the cargo. LDL-C tells you how much the cargo weighs. But the damage to your “shores” (your artery walls) isn’t caused by how heavy the cargo is; it’s caused by the number of ships that crash into the wall. Every single “bad” particle—whether it is LDL, VLDL, or IDL—has exactly one ApoB molecule on its surface. By measuring ApoB, we are counting the actual number of “ships” in your blood.
| Measurement | What it measures | The Analogy | Clinical Impact |
| LDL-C | Total mass/weight of cholesterol | The weight of all the cargo | Can miss risk in people with “light” but numerous particles. |
| ApoB | Total particle count | The number of cargo ships | Shows the actual “dose” of risk being delivered to the heart. |
Roughly 20% of the population has “discordant” levels, meaning their LDL-C weight looks fine, but their ApoB ship count is dangerously high. Counting the ships provides a much more accurate prediction of who will eventually suffer a heart event.
Lesson 3: The “Hidden” Danger of Small, Dense LDL
This concept of “discordance” is particularly dangerous for people with metabolic issues, such as insulin resistance or type 2 diabetes. In these individuals, the liver overproduces large particles called VLDL. As these travel through the blood, they exchange their contents and shrink, turning into “small, dense” LDL.
Think of the difference between pebbles and sand. If you throw pebbles at a stone wall, most will bounce off. But if you have fine sand, it can easily get trapped in the smallest cracks. In your body, these tiny, “sticky” LDL particles enter the subendothelial proteoglycan matrix—the structural “netting” of your artery walls—and get stuck there. Once trapped, they become oxidized, which is the exact moment heart disease begins.
Because these particles are so small, they don’t weigh much. A traditional LDL-C test might show a “normal” weight, entirely missing the fact that there are billions of these tiny “sand grains” embedding themselves in your arteries. This is why many people have heart attacks despite having “good” cholesterol numbers on old-fashioned tests.
Lesson 4: The Genetic Ghost in the Machine (Lipoprotein(a))
There is one specific particle that no amount of kale or cardio can fix: Lipoprotein(a), or Lp(a). This is a standard LDL particle that features a unique protein called Apolipoprotein(a), which acts like a “sticky velcro attachment.”
This velcro makes the particle significantly more likely to get stuck in your arteries, promote dangerous blood clots, and contribute to calcific aortic valve stenosis—a hardening of the heart’s main valve. Your Lp(a) level is 70-90% determined by your DNA; you are born with it.
“High levels of Lipoprotein(a) act as a genetic vanguard for heart disease, affecting over 1.5 billion people globally.”
The 2026 guidelines recommend that every adult get a one-time Lp(a) test. While standard treatments like statins don’t lower it, we have entered an era of hope. New RNA-based therapies, such as Pelacarsen and Olpasiran, are currently in trials and have shown the ability to lower these dangerous particles by up to 95% by literally silencing the gene that creates them.
Lesson 5: Heart Health is a 30-Year Video, Not a 10-Year Snapshot
In the past, doctors used the “Framingham” model, which looked at your risk of having a heart attack in the next 10 years. If you were 35 and your risk was low, they told you not to worry.
The 2026 paradigm uses the PREVENT equations, which look at a 30-year “life-course” window. Instead of a single snapshot of your health today, we are looking at the “30-year video.”
This is the concept of Area Under the Curve. Think of it like a savings account, but in reverse. If you have high cholesterol for 30 years, that “cumulative dose” of damage builds up like compound interest on a debt. Waiting until you are 50 to lower your cholesterol is like waiting until you are 60 to start saving for retirement; you’ve already missed the most impactful years.
By using Polygenic Risk Scores (PRS), we can now identify the “invisible” 8% of the population who have a high genetic risk despite appearing healthy. Starting prevention at age 30, rather than age 50, can fundamentally change the trajectory of your life.
Conclusion: From Surviving to Thriving
We are moving away from the era of “crisis management”—where we wait for a heart attack to happen and then try to repair the damage—and toward an era of precision prevention.
The goal for those at very high risk is now an LDL-C of <55 mg/dL. For those seeking “primordial prevention”—the act of stopping the disease from ever starting—the target is to maintain levels similar to those of a newborn baby, between 30 and 70 mg/dL, throughout their entire adult life.
Heart disease was once viewed as an inevitable consequence of aging, but the Tsimane and our modern understanding of lipidology prove otherwise. It is a process we can slow, stop, and in many cases, prevent entirely.
The next time you review your lab results, ask yourself: Am I satisfied with being “average” in a sick population? Or am I ready to look at my actual particle count and take control of my heart’s 30-year video?
DEEP DIVE
The Evolution of Cardiovascular Risk Assessment and Lipid Management:
A Life-Course Analysis from 1960 to 2026
Introduction
The historical trajectory of cardiovascular medicine represents a profound shift from reactive management of end-stage clinical events to a proactive, life-course paradigm centered on the physiological drivers of atherosclerosis. Since the mid-twentieth century, the medical community’s understanding of lipid metabolism has evolved from a focus on crude total cholesterol measurements to a nuanced appreciation of lipoprotein particle concentration, genetic predisposition, and the cumulative burden of atherogenic exposure. As of 2026, the clinical focus has moved toward identifying risk decades before the onset of symptomatic disease, utilizing advanced biomarkers such as Apolipoprotein B (ApoB) and Lipoprotein(a) [Lp(a)], and incorporating polygenic risk scores into standardized assessment tools.1
Historical Shifts in Cholesterol Guidelines and Clinical Targets
The conceptualization of cholesterol as a primary agent of vascular pathology was not an immediate consensus but rather a hard-won evolution through decades of epidemiological observation and clinical trial evidence. In the 1960s, the ‘cholesterol controversy’ was at its zenith, with researchers debating whether blood lipids were merely correlates of aging or causative agents of heart disease.2
The Pre-NCEP Era and the Rise of the Lipid Hypothesis
Prior to the formalization of national guidelines, ‘acceptable’ total cholesterol levels were remarkably high by modern standards. In the 1960s and early 1970s, clinicians commonly regarded total cholesterol levels of 240 mg/dL or higher as normal for aging adults. This perception was rooted in average population levels of the time, where the mean total cholesterol for U.S. adults aged 20–74 was approximately 222 mg/dL between 1959 and 1962.3 Early interventions were primarily dietary. The American Heart Association issued its first formal dietary recommendations in 1961 and updated them in 1968, advocating restriction of saturated fat and dietary cholesterol. These early targets reflected a nascent understanding that dietary saturated fat influenced serum cholesterol levels, though the magnitude of this effect was often overestimated in isolation from the broader dietary context.4
The National Cholesterol Education Program and the Adult Treatment Panels
The 1980s marked a pivotal transition with the establishment of the National Cholesterol Education Program (NCEP). The release of the first Adult Treatment Panel (ATP I) report in 1988 provided the first standardized framework for identifying and treating high blood cholesterol.5
Table 1. Evolution of U.S. Cholesterol Guidelines, 1988–2026
| Guideline Report | Year | Primary Focus | LDL-C Targets / Key Changes |
| NCEP ATP I | 1988 | Primary prevention; total cholesterol and LDL-C screening. | LDL-C <160 mg/dL (low risk); <130 mg/dL (high risk). |
| NCEP ATP II | 1993 | Secondary prevention for established CHD; emphasized HDL-C. | LDL-C <100 mg/dL for secondary prevention. |
| NCEP ATP III | 2001 | 10-year risk assessment (Framingham); CHD ‘risk equivalents’ including diabetes. | Optimal LDL-C <100 mg/dL; low HDL-C defined as <40 mg/dL. |
| ATP III Update | 2004 | Intensified therapy for ‘very high risk’ individuals. | Optional LDL-C <70 mg/dL for very high risk. |
| 2013 ACC/AHA | 2013 | Abandoned treat-to-target; identified four statin benefit groups. | High- vs. moderate-intensity statin therapy; no specific LDL-C target. |
| 2018 AHA/ACC Multisociety | 2018 | Return to thresholds; risk-based escalation with non-statin agents. | LDL-C <70 mg/dL (high risk); <55 mg/dL (very high risk). |
| 2026 ACC/AHA Dyslipidemia Guideline | 2026 | Life-course prevention; PREVENT equations for 10- and 30-year risk; ApoB and Lp(a) screening. | LDL-C <55 mg/dL (very high risk); universal one-time Lp(a) testing. |
NCEP = National Cholesterol Education Program; ATP = Adult Treatment Panel; ACC = American College of Cardiology; AHA = American Heart Association.
The rationale for progressively lower targets was driven by a robust accumulation of evidence from randomized controlled trials. The Lipid Research Clinics Coronary Primary Prevention Trial (LRC-CPPT) in 1984 demonstrated that for every 1% reduction in total cholesterol, CHD risk fell by approximately 2%, providing an early statistical foundation for aggressive lipid-lowering.6 Subsequent trials in the 1990s and early 2000s—the Scandinavian Simvastatin Survival Study (4S), the Cholesterol and Recurrent Events trial (CARE), and the Long-Term Intervention with Pravastatin in Ischaemic Disease (LIPID) study—consistently showed that lowering LDL-C reduced major adverse cardiovascular events (MACE), leading to broad adoption of the ‘lower is better’ philosophy.7
The 2013 Paradigm Shift and the Move to Statin Intensity
A significant disruption occurred in 2013 with the release of the ACC/AHA cholesterol guidelines. This report moved away from specific LDL-C numerical targets, instead identifying four ‘statin benefit groups’ where evidence for risk reduction was most compelling: (1) individuals with clinical atherosclerotic cardiovascular disease (ASCVD); (2) individuals with primary LDL-C elevations ≥190 mg/dL; (3) individuals aged 40–75 years with diabetes and LDL-C 70–189 mg/dL; and (4) individuals aged 40–75 years without clinical ASCVD or diabetes, with LDL-C 70–189 mg/dL and an estimated 10-year ASCVD risk ≥7.5%.8 This approach prioritized the intensity of statin therapy over the achievement of a specific LDL-C level. However, this shift was controversial, as many clinicians felt it reduced motivation for patient adherence and neglected individual variability in drug response.9
The Return to Targets and the 2026 Life-Course Paradigm
The 2018 ACC/AHA Multisociety guidelines and the 2026 ACC/AHA/AACVPR/ABC/ACPM/ADA/AGS/APhA/ASPC/NLA/PCNA Guideline on the Management of Dyslipidemia restored explicit LDL-C treatment targets with a significantly expanded scope. Published in the Journal of the American College of Cardiology and co-published in Circulation, the 2026 guideline emphasizes earlier risk assessment beginning at age 30 and mandates use of the PREVENT (Predicting Risk of Cardiovascular Disease EVENTs) equations to estimate both 10-year and 30-year lifetime risk.1 For adults aged 30–79 years without known ASCVD and with LDL-C 70–189 mg/dL, the PREVENT-ASCVD equations classify 10-year risk as low (<3%), borderline (3% to <5%), intermediate (5% to <10%), or high (≥10%). For very high-risk individuals (defined as those with multiple major ASCVD events or one major event plus multiple high-risk conditions), the guideline recommends an LDL-C target of <55 mg/dL.1 This reflects the modern understanding that atherosclerosis is a lifelong cumulative process, where the ‘area under the curve’ of atherogenic lipoprotein exposure determines ultimate event risk.10
Population Averages Versus Optimal Biological Health
A central theme in contemporary lipidology is the recognition that ‘average’ or ‘normal’ cholesterol levels in industrialized populations do not represent health but rather a high-risk baseline shaped by diet, physical inactivity, and metabolic disease.11
NHANES Trends in Mean Cholesterol: 1960 to Present
Data from the National Health and Nutrition Examination Survey (NHANES) document a steady decline in mean total cholesterol among U.S. adults aged 20–74 years, from approximately 222 mg/dL in 1959–1962 to 197 mg/dL by 2007–2008.3 Despite this encouraging trend, the mean U.S. adult cholesterol profile continues to facilitate atherosclerotic plaque progression. The prevalence of high total cholesterol (≥240 mg/dL) declined from approximately 20% in 1988–1994 to 11.3% in 2021–2023, though this plateau has persisted since approximately 2013–2014.12
Table 2. NHANES Trends in Total Cholesterol and LDL-C in U.S. Adults Aged 20–74 Years
| NHANES Period | Mean Total Cholesterol (mg/dL) | Mean LDL-C (mg/dL) | Prevalence of High TC (≥240 mg/dL) |
| 1959–1962 | ~222 | N/A | High (estimated) |
| 1971–1975 | ~216 | N/A | N/A |
| 1976–1980 | ~213 | ~137 | N/A |
| 1988–1994 | ~206 | ~129 | ~20% |
| 2007–2008 | ~197 | ~116 | ~17% |
| 2021–2023 | N/A | N/A | ~11.3% |
Sources: Carroll et al. (2012); Curtin et al. (2024). N/A = data not available from cited surveys.
The prevalence of metabolic dysfunction—characterized by obesity, hyperinsulinemia, and insulin resistance—has shifted the ‘normal’ distribution toward higher triglycerides and lower HDL-C, creating a population where the average individual is actively developing vascular lesions.13 In striking contrast, human neonates typically possess LDL-C levels between 30 and 70 mg/dL, consistent with levels observed in wild-type primates and other mammals that do not spontaneously develop atherosclerosis.14
Lessons from the Tsimane of the Bolivian Amazon
The Tsimane population of the Bolivian Amazon provides a unique biological benchmark. A landmark 2017 cross-sectional cohort study published in The Lancet found that the Tsimane have the lowest reported prevalence of coronary atherosclerosis of any population yet studied—five times lower than comparable U.S. populations.15 In a sample of 705 adults aged 40–94 years, 85% had a coronary artery calcium (CAC) score of zero, and among those aged over 75 years, 65% still had no measurable coronary calcification—a five-fold lower prevalence than age-matched Americans in the Multi-Ethnic Study of Atherosclerosis (MESA).15
The mean LDL-C of Tsimane participants was 91 mg/dL and mean HDL-C was 39.5 mg/dL.15 Notably, this low burden of atherosclerosis persisted despite elevated systemic inflammation: high-sensitivity C-reactive protein exceeded the clinical cutoff of 3.0 mg/dL in 51% of Tsimane participants, attributable to a high infectious and parasitic burden rather than vascular inflammation.15 These findings suggest that atherosclerosis is not an inevitable consequence of aging or inflammation alone, but requires a critical threshold of circulating atherogenic lipoprotein exposure—a threshold exceeded in virtually all contemporary Western populations.15
Apolipoprotein B as a Superior Measure of Atherogenic Risk
While LDL-C measures the total mass of cholesterol within LDL particles, it does not account for the total number of atherogenic lipoprotein particles or the heterogeneity of their composition. Apolipoprotein B (ApoB) is the structural protein present in a 1:1 ratio on every potentially atherogenic particle, including VLDL, IDL, LDL, and Lp(a).16
The Mechanistic Case for ApoB Superiority
The emerging consensus in lipidology holds that the total number of atherogenic particles is the primary driver of the ‘response-to-retention’ mechanism of atherosclerosis initiation. Atherosclerosis begins when ApoB-containing particles traverse the endothelial barrier and become trapped within the subendothelial proteoglycan matrix.17 Because each such particle carries one ApoB molecule, ApoB measurement directly quantifies the total atherogenic particle burden delivered to the arterial wall—a metric more physiologically precise than the cholesterol content of LDL particles alone.16
Discordance Between ApoB and LDL-C in Metabolic Disease
The limitations of LDL-C are most apparent in individuals with insulin resistance, type 2 diabetes, or hypertriglyceridemia. Metabolic dysfunction leads to hepatic overproduction of large, triglyceride-rich VLDL particles. In the circulation, cholesteryl ester transfer protein (CETP) exchanges triglycerides from VLDL for cholesterol esters in LDL particles, and the resulting triglyceride-enriched LDL undergoes hydrolysis by hepatic lipase to yield small, dense LDL (sdLDL).18 These sdLDL particles are cholesterol-depleted per particle, producing paradoxically low LDL-C values despite a high total ApoB (and particle) count. A systematic review and meta-analysis demonstrated that such ApoB/LDL-C discordance is prevalent in metabolic disease and is associated with significant underestimation of cardiovascular risk.13
Table 3. ApoB/LDL-C Discordance Patterns by Metabolic State
| Metabolic State | LDL-C Level | ApoB Level | Clinical Implication |
| Healthy insulin sensitivity | Concordant (e.g., 100 mg/dL) | Concordant (e.g., 80 mg/dL) | Risk accurately estimated by either metric. |
| Insulin resistance / type 2 diabetes | Discordantly low (e.g., 90 mg/dL) | Discordantly high (e.g., 110 mg/dL) | Risk underestimated by LDL-C alone. |
| High saturated fat intake (large LDL phenotype) | Discordantly high (e.g., 160 mg/dL) | Relatively lower (e.g., 100 mg/dL) | Risk may be overestimated by LDL-C. |
Adapted from: Tsoupras et al. (2024); Fahed et al. (2022).
Analyses of NHANES data have shown that approximately 20% of the general U.S. population exhibits clinically significant discordance between ApoB and LDL-C, with this proportion rising substantially among those with metabolic syndrome.19 Individuals with high ApoB but concordantly low LDL-C demonstrate significantly higher rates of coronary artery calcification and chronic kidney disease than those with the inverse pattern, confirming that particle number is the mechanistically relevant driver of atherogenesis.20
Small, Dense LDL: The Mechanistic Link
Small, dense LDL particles are uniquely hazardous for three principal reasons. First, their reduced size facilitates penetration of the arterial intima. Second, they exhibit enhanced affinity for subendothelial proteoglycans, leading to prolonged retention at the site of atherogenesis. Third, they are more susceptible to oxidative modification—the prerequisite step for macrophage uptake and foam cell formation.21 Clinically, a patient with a ‘normal’ LDL-C but elevated ApoB or LDL particle number carries a risk profile that is systematically concealed by standard lipid screening.13
Lipoprotein(a): The Genetic Vanguard of ASCVD Risk
Lipoprotein(a) [Lp(a)] has only recently attained widespread clinical recognition despite being identified in the 1960s. Its Lp(a) levels are approximately 70–90% genetically determined by variation at the LPA gene locus and are not meaningfully altered by lifestyle modification or conventional statin therapy.22
Role in Atherogenesis, Thrombosis, and Valvular Disease
Lp(a) consists of an LDL-like lipoprotein with an additional glycoprotein, apolipoprotein(a) [apo(a)], covalently attached to the ApoB-100 molecule via a disulfide bond.22 This structural configuration confers dual pathogenicity: Lp(a) is both highly atherogenic through its retention in the subendothelial space and is potentially prothrombotic through the structural homology of apo(a) with plasminogen, which may interfere with fibrinolysis.23 Elevated Lp(a) is also a major independent risk factor for calcific aortic valve stenosis; individuals with the highest Lp(a) levels face substantially higher risk of aortic valve replacement or aortic valve-related death.24
Screening Recommendations and Emerging Therapies
The 2026 ACC/AHA Dyslipidemia Guideline recommends at least one lifetime measurement of Lp(a) for all adults to identify individuals with high inherited cardiovascular risk.1 Elevated Lp(a)—generally defined as ≥50 mg/dL (or ≥125 nmol/L)—affects an estimated 20–25% of the global population, representing over 1.5 billion individuals, and contributes substantially to residual cardiovascular risk that is not addressed by statin therapy.23
Table 4. Emerging RNA-Based Therapies Targeting Lp(a) as of 2026
| Treatment Class | Mechanism of Action | Lp(a) Reduction | Development Status (2026) |
| Antisense oligonucleotides (ASO) | Binds to LPA mRNA to promote degradation via RNase H. | ~70–80% | Pelacarsen: Phase 3 cardiovascular outcomes trial (HORIZON) completed; results awaited. |
| siRNA therapies | Cleaves LPA mRNA via the RISC complex. | ~80–95% | Olpasiran (OCEAN[a]-OUTCOMES trial ongoing); Lepodisiran (Phase 3). |
| Oral small-molecule inhibitors | Disrupts the hepatic assembly of apo(a) and ApoB. | Significant reduction | Muvalaplin: Phase 2 completed; Phase 3 planned. |
Sources: Tsimikas (2022); Kronenberg & Mora (2025). RISC = RNA-induced silencing complex; mRNA = messenger RNA.
While these therapies are still awaiting definitive cardiovascular outcome trial results, they represent a transformative paradigm shift in our ability to pharmacologically address a previously ‘unreachable’ genetic risk factor.25
Cardiovascular Mortality Trends: 1970 to 2022
The decline in cardiovascular mortality since 1970 represents one of the most remarkable public health achievements of the modern era. A comprehensive analysis of U.S. National Vital Statistics System data for adults aged 25 years and older, published in the Journal of the American Heart Association in 2025, found that in 1970 heart disease accounted for 41% of all deaths; by 2022, this had fallen to 24%—an overall reduction in age-adjusted heart disease mortality of 66%.26
Deconstructing the Decline
Age-adjusted mortality from acute myocardial infarction (AMI) declined by 89% from 1970 to 2022, while total ischemic heart disease mortality fell by 81% over the same period.26 A landmark analysis by Ford et al. (2007) decomposed the decline in U.S. coronary heart disease deaths between 1980 and 2000, attributing approximately 44% to risk factor reductions (predominantly smoking cessation, lower mean blood pressure, and lower mean total cholesterol) and approximately 47% to improved medical and surgical treatments (including secondary prevention after MI, acute AMI treatments, and heart failure management).27
Table 5. Estimated Contributions to the Decline in U.S. Coronary Heart Disease Mortality, 1980–2000
| Factor | Estimated Contribution | Primary Mechanisms |
| Risk factor reductions | ~44% | Decline in smoking prevalence (~42% in 1965 to ~25% in 1995); lower mean systolic blood pressure; lower mean total cholesterol. |
| Medical and surgical treatments | ~47% | Secondary prevention after MI (~11%); acute AMI treatments (thrombolytics, PCI) (~10%); heart failure management (~9%); coronary revascularization (~5%). |
| Other / unexplained | ~9% | Including changes in physical activity, diet, and unmeasured confounders. |
Adapted from: Ford et al. N Engl J Med. 2007;356:2388–2398. MI = myocardial infarction; PCI = percutaneous coronary intervention.
However, a critical finding from the 2025 JAHA analysis reveals a concerning compositional shift: while deaths from acute myocardial infarction fell by 89%, mortality from non-ischemic heart conditions substantially increased. Deaths from heart failure rose by 146%, hypertensive heart disease by 106%, and arrhythmias by 450% over the study period.26 This pattern indicates that modern medicine has succeeded in preventing death from acute ischemic events—largely by converting them into survivable occurrences—but that the underlying atherosclerotic disease process, and the chronic organ damage that accrues over decades, continues largely unabated.26
Effectiveness of Statins: Relative Versus Absolute Risk Reduction
The success of statins is frequently expressed in terms of relative risk reduction (RRR). A Cholesterol Treatment Trialists’ (CTT) Collaboration meta-analysis of data from 170,000 participants in 26 randomized trials demonstrated a consistent ~21% proportional reduction in major vascular events per 1.0 mmol/L (38.7 mg/dL) reduction in LDL-C.28
Absolute Risk Reductions and the NNT Debate
Despite consistent relative benefits, a 2022 systematic review and meta-analysis of 21 eligible randomized trials published in JAMA Internal Medicine by Byrne et al. demonstrated that absolute risk reductions (ARRs) are substantially more modest, particularly in primary prevention settings.29
Table 6. Relative Risk Reduction, Absolute Risk Reduction, and NNT for Statin Therapy (pooled primary and secondary prevention trials; mean follow-up 4.4 years)
| Outcome | Relative Risk Reduction (95% CI) | Absolute Risk Reduction (95% CI) | Number Needed to Treat |
| All-cause mortality | 9% (5–14%) | 0.8% (0.4–1.2%) | ~125 |
| Myocardial infarction | 29% (22–34%) | 1.3% (0.9–1.7%) | ~77 |
| Stroke | 14% (5–22%) | 0.4% (0.2–0.6%) | ~250 |
Source: Byrne P, et al. JAMA Intern Med. 2022;182:474–481. CI = confidence interval; NNT = number needed to treat (calculated from ARR).
This RRR/ARR discrepancy has fueled debate over the sufficiency of current lipid-lowering strategies, particularly in low-risk primary prevention populations where baseline event rates are low. However, the 2026 guideline framework advocates a ‘life-course’ perspective: while the 5-year ARR for a low-risk individual starting statin therapy in middle age may be modest, the cumulative prevention of atherosclerotic plaque burden over 30–40 years could yield substantially larger lifetime benefits.1 The CTT Collaboration has reinforced this point, demonstrating that the proportional risk reduction is consistent across all baseline risk levels, meaning individuals who initiate therapy earlier—when absolute risk is lower—may accumulate the greatest lifetime benefit.28
Critical Synthesis: Toward a Precision Prevention Paradigm
Current cholesterol-focused strategies have achieved historically unprecedented reductions in acute cardiovascular mortality, yet substantial gaps remain. The longstanding focus on 10-year risk estimation in middle-aged individuals frequently misidentifies those with high lifetime risk who could benefit from earlier intervention.1
Persistent Gaps in Current Models
Metabolic oversight remains a critical vulnerability: traditional LDL-C metrics systematically underestimate cardiovascular risk in individuals with insulin resistance or type 2 diabetes, who may have elevated atherogenic particle burdens (as reflected by ApoB) despite apparently ‘normal’ LDL-C.13 Genetic blind spots persist, as standard lipid panels have historically been unable to detect elevated Lp(a) or polygenic predispositions to high LDL-C.22 Furthermore, the shift from AMI mortality toward heart failure, hypertensive heart disease, and arrhythmias—documented in the 2025 JAHA analysis—indicates that contemporary medicine is managing the sequelae of atherosclerosis rather than eradicating the disease process early enough in the life course.26
The 2026 Framework: Precision, Biomarker Refinement, and Genomic Integration
The 2026 ACC/AHA Dyslipidemia Guideline represents a move toward ‘precision prevention.’ Key advances include earlier risk assessment (beginning at age 30), use of the PREVENT equations for both 10- and 30-year risk estimates, selective incorporation of ApoB to resolve LDL-C/particle discordance, and universal one-time Lp(a) testing.1 The guideline also endorses selective use of coronary artery calcium (CAC) scoring for risk reclassification in individuals with borderline or intermediate 10-year risk.1
Table 7. Key Advances in the 2026 Precision Prevention Framework
| Advancement | Description | Impact on Risk Assessment |
| PREVENT Equations | 10- and 30-year risk tools incorporating kidney function (eGFR) and metabolic health; replaces Pooled Cohort Equations, which overestimated 10-year risk by 40–50%. | Enables quantification of lifetime risk in younger adults (ages 30–79), facilitating early lifestyle and pharmacological intervention. |
| Selective ApoB Measurement | Quantifies total atherogenic particle burden; resolves LDL-C/ApoB discordance. | Identifies metabolically unhealthy individuals whose risk is systematically underestimated by LDL-C. |
| Universal Lp(a) Screening | One-time measurement recommended for all adults to detect inherited Lp(a) elevation. | Identifies the ~20–25% of the population with genetically elevated Lp(a) who carry residual risk not addressed by conventional therapy. |
| CAC Scoring | Selective use for risk reclassification in borderline- and intermediate-risk individuals. | Provides direct anatomic evidence of subclinical atherosclerosis to guide statin initiation or de-intensification decisions. |
| Polygenic Risk Scores (PRS) | Combines thousands of common genetic variants into a composite cardiovascular disease risk score. | Reclassifies individuals with ‘borderline’ clinical risk to high-risk based on genetic susceptibility; incorporated into 2026 guideline narrative. |
Sources: Blumenthal et al. (2026); Khan et al. (2024); Khera et al. (2018).
In conclusion, the evolution of cardiovascular care since the 1960s has been a journey from managing crises to modifying biology. While the ‘average’ Western population remains at a pathologically elevated baseline, the tools available in 2026 allow for a level of personalized, life-course prevention that could theoretically render atherosclerotic events increasingly rare rather than the leading cause of death. Future research must prioritize cost-effectiveness and equitable scalability of advanced biomarker testing, as well as the long-term impact of ‘primordial’ prevention strategies aimed at maintaining LDL-C and ApoB at near-physiological levels throughout adult life.11014
References
- Writing Committee Members, Blumenthal RS, Morris PB, et al. 2026 ACC/AHA/AACVPR/ABC/ACPM/ADA/AGS/APhA/ASPC/NLA/PCNA Guideline on the Management of Dyslipidemia: A Report of the American College of Cardiology/American Heart Association Joint Committee on Clinical Practice Guidelines. Circulation. Published online March 13, 2026. doi:10.1161/CIR.0000000000001423
- Steinberg D. Thematic review series: the pathogenesis of atherosclerosis. An interpretive history of the cholesterol controversy: part I. J Lipid Res. 2004;45(9):1583-1593. doi:10.1194/jlr.R400003-JLR200
- Carroll MD, Lacher DA, Sorlie PD, et al. Trends in serum lipids and lipoproteins of adults, 1960-2002. JAMA. 2005;294(14):1773-1781. doi:10.1001/jama.294.14.1773
- Hooper L, Martin N, Jimoh OF, Kirk C, Foster E, Abdelhamid AS. Reduction in saturated fat intake for cardiovascular disease. Cochrane Database Syst Rev. 2020;5(5):CD011737. Published 2020 May 19. doi:10.1002/14651858.CD011737.pub2
- Report of the National Cholesterol Education Program Expert Panel on Detection, Evaluation, and Treatment of High Blood Cholesterol in Adults. The Expert Panel. Arch Intern Med. 1988;148(1):36-69.
- The Lipid Research Clinics Coronary Primary Prevention Trial results. I. Reduction in incidence of coronary heart disease. JAMA. 1984;251(3):351-364. doi:10.1001/jama.1984.03340270029025
- Baigent C, Keech A, Kearney PM, et al. Efficacy and safety of cholesterol-lowering treatment: prospective meta-analysis of data from 90,056 participants in 14 randomised trials of statins. Lancet. 2005;366(9493):1267-1278. doi:10.1016/S0140-6736(05)67394-1
- Stone NJ, Robinson JG, Lichtenstein AH, et al. 2013 ACC/AHA guideline on the treatment of blood cholesterol to reduce atherosclerotic cardiovascular risk in adults: a report of the American College of Cardiology/American Heart Association Task Force on Practice Guidelines. J Am Coll Cardiol. 2014;63(25 Pt B):2889-2934. doi:10.1016/j.jacc.2013.11.002
- Grundy SM, Stone NJ, Bailey AL, et al. 2018 AHA/ACC/AACVPR/AAPA/ABC/ACPM/ADA/AGS/APhA/ASPC/NLA/PCNA Guideline on the Management of Blood Cholesterol: A Report of the American College of Cardiology/American Heart Association Task Force on Clinical Practice Guidelines. Circulation. 2019;139(25):e1082-e1143. doi:10.1161/CIR.0000000000000625
- Ference BA, Ginsberg HN, Graham I, et al. Low-density lipoproteins cause atherosclerotic cardiovascular disease. 1. Evidence from genetic, epidemiologic, and clinical studies. A consensus statement from the European Atherosclerosis Society Consensus Panel. Eur Heart J. 2017;38(32):2459-2472. doi:10.1093/eurheartj/ehx144
- Reiner Ž. Hypertriglyceridaemia and risk of coronary artery disease. Nat Rev Cardiol. 2017;14(7):401-411. doi:10.1038/nrcardio.2017.31
- Carroll MD, Fryar CD, Gwira JA, Iniguez M. Total and High-density Lipoprotein Cholesterol in Adults: United States, August 2021-August 2023. NCHS Data Brief. 2024;(515):CS354900. doi:10.15620/cdc/165796
- Tsoupras A, Lordan R, Zabetakis I. Inflammation, not Cholesterol, Is a Cause of Chronic Disease. Nutrients. 2018;10(5):604. Published 2018 May 12. doi:10.3390/nu10050604
- Napoli C, Glass CK, Witztum JL, Deutsch R, D’Armiento FP, Palinski W. Influence of maternal hypercholesterolaemia during pregnancy on progression of early atherosclerotic lesions in childhood: Fate of Early Lesions in Children (FELIC) study. Lancet. 1999;354(9186):1234-1241. doi:10.1016/S0140-6736(99)02131-5
- Kaplan H, Thompson RC, Trumble BC, et al. Coronary atherosclerosis in indigenous South American Tsimane: a cross-sectional cohort study. Lancet. 2017;389(10080):1730-1739. doi:10.1016/S0140-6736(17)30752-3
- Ference BA, Graham I, Tokgozoglu L, Catapano AL. Impact of Lipids on Cardiovascular Health: JACC Health Promotion Series. J Am Coll Cardiol. 2018;72(10):1141-1156. doi:10.1016/j.jacc.2018.06.046
- Williams KJ, Tabas I. The response-to-retention hypothesis of early atherogenesis. Arterioscler Thromb Vasc Biol. 1995;15(5):551-561. doi:10.1161/01.atv.15.5.551
- Ivanova EA, Myasoedova VA, Melnichenko AA, Grechko AV, Orekhov AN. Small Dense Low-Density Lipoprotein as Biomarker for Atherosclerotic Diseases. Oxid Med Cell Longev. 2017;2017:1273042. doi:10.1155/2017/1273042
- Witt C, Renfroe LG, Lyons TS. Discordance between serum cholesterol concentration and atherogenic lipoprotein particle number in people with metabolic disease: A systematic review. Diabetes Obes Metab. 2025;27(6):2940-2954. doi:10.1111/dom.16335
- Pischon T, Girman CJ, Sacks FM, Rifai N, Stampfer MJ, Rimm EB. Non-high-density lipoprotein cholesterol and apolipoprotein B in the prediction of coronary heart disease in men. Circulation. 2005;112(22):3375-3383. doi:10.1161/CIRCULATIONAHA.104.532499
- Ivanova EA, Myasoedova VA, Melnichenko AA, Grechko AV, Orekhov AN. Small Dense Low-Density Lipoprotein as Biomarker for Atherosclerotic Diseases. Oxid Med Cell Longev. 2017;2017:1273042. doi:10.1155/2017/1273042
- Tsimikas S. A Test in Context: Lipoprotein(a): Diagnosis, Prognosis, Controversies, and Emerging Therapies. J Am Coll Cardiol. 2017;69(6):692-711. doi:10.1016/j.jacc.2016.11.042
- Kronenberg F, Mora S, Stroes ESG, et al. Lipoprotein(a) in atherosclerotic cardiovascular disease and aortic stenosis: a European Atherosclerosis Society consensus statement. Eur Heart J. 2022;43(39):3925-3946. doi:10.1093/eurheartj/ehac361
- Coassin S, Kronenberg F. Lipoprotein(a) beyond the kringle IV repeat polymorphism: The complexity of genetic variation in the LPA gene. Atherosclerosis. 2022;349:17-35. doi:10.1016/j.atherosclerosis.2022.04.003
- Perez AD, Simpson RJ Jr, Komé AM, Lopez ST. Emerging therapies targeting lipoprotein(a): Pharmacologic advances and future directions. J Pharmacol Exp Ther. 2025;392(12):103695. doi:10.1016/j.jpet.2025.103695
- King SJ, Wangdak Yuthok TY, Bacong AM, et al. Heart Disease Mortality in the United States, 1970 to 2022. J Am Heart Assoc. 2025;14(13):e038644. doi:10.1161/JAHA.124.038644
- Ford ES, Ajani UA, Croft JB, et al. Explaining the decrease in U.S. deaths from coronary disease, 1980-2000. N Engl J Med. 2007;356(23):2388-2398. doi:10.1056/NEJMsa053935
- Cholesterol Treatment Trialists’ (CTT) Collaboration, Baigent C, Blackwell L, et al. Efficacy and safety of more intensive lowering of LDL cholesterol: a meta-analysis of data from 170,000 participants in 26 randomised trials. Lancet. 2010;376(9753):1670-1681. doi:10.1016/S0140-6736(10)61350-5
- Byrne P, Demasi M, Jones M, Smith SM, O’Brien KK, DuBroff R. Evaluating the Association Between Low-Density Lipoprotein Cholesterol Reduction and Relative and Absolute Effects of Statin Treatment: A Systematic Review and Meta-analysis. JAMA Intern Med. 2022;182(5):474-481. doi:10.1001/jamainternmed.2022.0134