


The Heart Health App That Finally Asks the Right Question
There are hundreds of heart health apps on the market today. Most of them do the same thing: they monitor your heart rate, track your steps, measure your sleep, and tell you to eat more vegetables. Some of the more sophisticated ones connect to wearables and give you a real-time readout of your pulse. A few will even flag an irregular heartbeat.
These are useful tools. But they are all answering a different question.
Heart rate monitors tell you what your heart is doing right now. What they cannot tell you — what no wearable on your wrist can tell you — is what your heart is likely to do in ten, twenty, or thirty years based on the genetic blueprint you inherited from your family. That question requires a completely different kind of tool. And until now, no app has been built to answer it properly.
That changes today.
Introducing the Heart Risk Calculator
The Heart Risk Calculator is now available on Google Play, and it represents something genuinely new in the heart health app space. It is not a heart rate monitor. It is not a step counter. It is not a meditation timer or a blood pressure log. To our knowledge, it is among the first consumer apps designed specifically to quantify inherited cardiovascular risk using a weighted family-history framework — the Inherited Hazard Coefficient (IHC) — derived from principles established in peer-reviewed literature published in Circulation, JAMA, the European Heart Journal, and the Lancet. [1],[2],[3],[4]
The core insight behind this app is simple but profound: your family history is not a yes or no question.
Standard heart risk calculators — including the widely used Framingham Risk Score — ask whether you have a family history of heart disease. [1] Yes or no. That’s it. A grandparent dying of a heart attack at 82 and a sibling collapsing from sudden cardiac death at 39 both get the same checkbox. They are not the same thing. Not even close. And the research is unambiguous about this. [3],[5]
What Makes This App Different
It Asks Who, Not Just Whether
The Heart Risk Calculator organizes your family’s cardiac history by relationship, age at event, and severity of outcome. A fatal event in a first-degree relative at age 40 carries a fundamentally different inherited signal than a non-fatal event in a grandparent at age 75. The app captures that difference mathematically, using an evidence-informed weighting framework developed from published epidemiologic observations by Peter Megdal, PhD:
H = Σ (R × W) / A
Where R is the relation coefficient (0.5 for parents and siblings, 0.25 for grandparents and aunts and uncles), W is the severity weight of the cardiac event, and A is the age at which the event occurred. The equation is an evidence-informed educational framework that combines established epidemiologic risk principles into a structured score — providing a structured estimate of inherited familial cardiac risk that no standard checkbox can capture.
It Reveals the Imaging Trap
One of the most important — and most alarming — findings in recent cardiovascular research is what clinicians call the Imaging Trap. A standard Coronary Artery Calcium scan, one of the most commonly used screening tools in cardiology, can return a score of zero even while dangerous soft, non-calcified plaque is actively building in your arteries. [6] For people with a significant inherited cardiac risk, a zero calcium score may provide false reassurance in selected patients.
The 2025 CAUGHT-CAD randomized trial confirmed that in patients with a family history of premature coronary artery disease, Coronary CT Angiography may identify non-calcified plaque not detected by calcium scoring and may influence management in selected patients. [7] The Heart Risk Calculator is built around this research. It helps you understand whether your family history pattern may place you among people for whom additional discussion with a physician about imaging options could be appropriate.
It Captures What Wearables Completely Miss
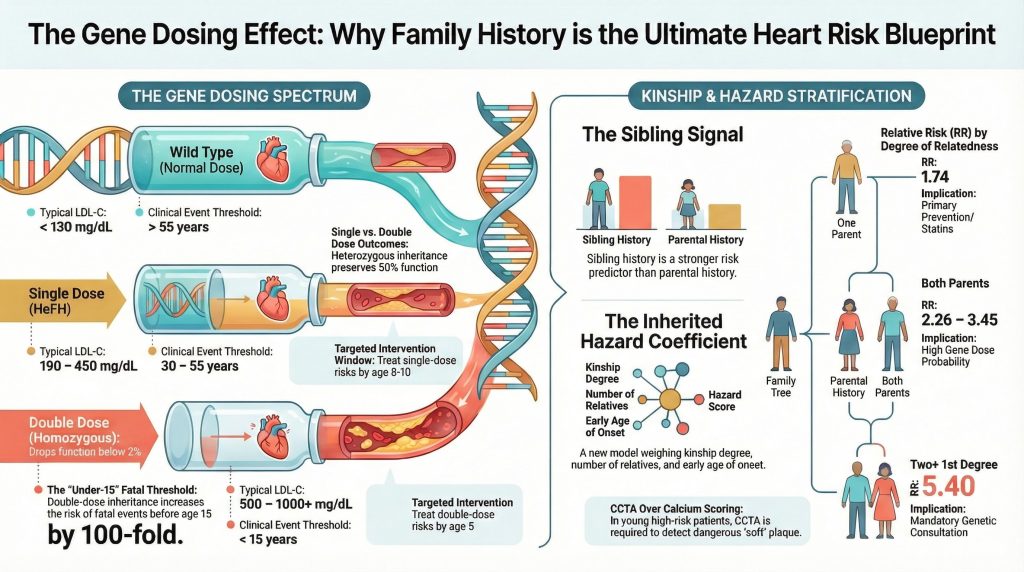
Your Apple Watch knows your resting heart rate. It does not know that your brother had a fatal heart attack at 42. Your Fitbit tracks your sleep quality. It cannot tell you that a sibling with premature heart disease confers an odds ratio of 2.46 for your own cardiac risk — a figure documented in peer-reviewed research published in JAMA. [5] Your Garmin measures your VO2 max. It has no way of accounting for the additive inherited burden — what researchers call gene dosing — that occurs when multiple close relatives develop premature cardiovascular disease, substantially increasing the probability of inherited genetic susceptibility. [3],[8]
Wearables measure what is happening in your body right now. The Heart Risk Calculator models the inherited familial signal reflected in your family history and what it suggests about your lifetime cardiac trajectory. Wearables and family-history tools provide complementary but different information — but only one of them helps identify people who may benefit from more intensive evaluation than standard screening provides.
It Gives You Something to Bring to Your Doctor
Every output from the Heart Risk Calculator is framed as a conversation starter, not a conclusion. The app generates a discussion-ready family history summary and a set of specific, clinically grounded questions you can bring to your next appointment. Questions like: given my family pattern, could I have soft plaque that a standard calcium scan would miss? Should I be referred to a preventive cardiologist rather than managed in primary care? Does my family history change how standard risk tools should be interpreted in my case? [9]
These are the questions that can genuinely change the course of a clinical encounter. They are the questions that turn a routine annual physical into a meaningful cardiovascular conversation. And they are the questions that most people never know to ask — because no one has ever organized their family history in a way that makes those questions visible.
It Is Built on Real Science
The Heart Risk Calculator is not a wellness app built on general advice. The concepts incorporated into its framework are informed by more than 40 peer-reviewed publications spanning inherited cardiac risk, premature coronary artery disease, family history epidemiology, and the genetics of cardiovascular susceptibility. The gene dosing model underlying the Inherited Hazard Coefficient draws on foundational research in inherited cardiovascular disease published in Nature Reviews Cardiology, the Lancet, and the European Heart Journal. [4],[8] The parental and sibling risk data come from landmark studies in JAMA and Circulation. [3],[5] The clinical significance of early cardiac events in close relatives — and the inadequacy of standard tools in capturing that significance — is documented across decades of cardiovascular epidemiology. [9]
This is not an algorithm someone built in a weekend. It is an evidence-informed educational framework, developed as an educational tool by Peter Megdal, PhD, that applies established epidemiologic principles to a problem that standard tools have never been designed to solve.
Why This Matters Right Now
Heart disease remains the number one cause of death in the United States. [10] Roughly half of all Americans have a family history of cardiac events. [11] And yet the tools available to most people for understanding their inherited risk remain remarkably primitive — a checkbox on an intake form, a Framingham score that was never designed to capture genetic loading, [1] and a calcium scan that may miss the most dangerous plaque entirely in younger, gene-dosed individuals. [6],[9]
For a 20-year-old whose sibling died of sudden cardiac death at 38, the Framingham Risk Score will often return a ten-year risk of under one percent — because the formula is driven by chronological age, not inherited biology. [1] That person’s inherited risk profile may warrant substantially more evaluation than suggested by conventional calculators. And without a tool that models the inherited familial signal in their family history, they will never know to ask the right questions until it is too late.
The Heart Risk app exists for that person. It exists for everyone who has sat in a doctor’s office and said “yes, there’s heart disease in my family” and watched that information disappear into a checkbox that changes nothing about their care.
Download It Today
The Heart Risk Calculator app is available now on Google Play for $4.99. It is an educational tool, not a medical device, and it does not replace clinical evaluation. But it may be the most important five dollars you spend on your heart health — not because it monitors your pulse, but because it finally asks the question that wearables and standard calculators have never been designed to answer.
Your family history is data. It’s time to use it.
This tool is for educational purposes only and does not constitute medical advice. The score has not been prospectively validated for predicting individual cardiovascular events and should not be used to diagnose disease. Always consult a qualified healthcare professional before making health decisions. Research by Peter Megdal, PhD — CuringHeartDisease.com
References
- D’Agostino RB Sr, Vasan RS, Pencina MJ, et al. General cardiovascular risk profile for use in primary care: the Framingham Heart Study. Circulation. 2008;117(6):743-753. doi:10.1161/CIRCULATIONAHA.107.699579.
- Virani SS, Alonso A, Aparicio HJ, et al. Heart Disease and Stroke Statistics-2021 Update: A Report From the American Heart Association. Circulation. 2021;143(8):e254-e743. doi:10.1161/CIR.0000000000000950
- Lloyd-Jones DM, Nam BH, D’Agostino RB Sr, et al. Parental cardiovascular disease as a risk factor for cardiovascular disease in middle-aged adults: a prospective study of parents and offspring. JAMA. 2004;291(18):2204-2211. doi:10.1001/jama.291.18.2204
- Ference BA, Ginsberg HN, Graham I, et al. Low-density lipoproteins cause atherosclerotic cardiovascular disease. 1. Evidence from genetic, epidemiologic, and clinical studies. A consensus statement from the European Atherosclerosis Society Consensus Panel. Eur Heart J. 2017;38(32):2459-2472. doi:10.1093/eurheartj/ehx144
- Murabito JM, Pencina MJ, Nam BH, et al. Sibling cardiovascular disease as a risk factor for cardiovascular disease in middle-aged adults. JAMA. 2005;294(24):3117-3123. doi:10.1001/jama.294.24.3117
- Villines TC, Hulten EA, Shaw LJ, et al. Prevalence and severity of coronary artery disease and adverse events among symptomatic patients with coronary artery calcification scores of zero undergoing coronary computed tomography angiography: results from the CONFIRM (Coronary CT Angiography Evaluation for Clinical Outcomes: An International Multicenter) registry. J Am Coll Cardiol. 2011;58(24):2533-2540. doi:10.1016/j.jacc.2011.10.851
- Nerlekar N, Vasanthakumar SA, Whitmore K, et al. Effects of Combining Coronary Calcium Score With Treatment on Plaque Progression in Familial Coronary Artery Disease: A Randomized Clinical Trial. JAMA. 2025;333(16):1403-1412. doi:10.1001/jama.2025.0584
- Bachmann JM, Willis BL, Ayers CR, Khera A, Berry JD. Association between family history and coronary heart disease death across long-term follow-up in men: the Cooper Center Longitudinal Study. Circulation. 2012;125(25):3092-3098. doi:10.1161/CIRCULATIONAHA.111.065490
- Arnett DK, Blumenthal RS, Albert MA, et al. 2019 ACC/AHA Guideline on the Primary Prevention of Cardiovascular Disease: A Report of the American College of Cardiology/American Heart Association Task Force on Clinical Practice Guidelines. Circulation. 2019;140(11):e596-e646. doi:10.1161/CIR.0000000000000678
- Martin SS, Aday AW, Allen NB, et al. 2025 Heart Disease and Stroke Statistics: A Report of US and Global Data From the American Heart Association. Circulation. 2025;151(8):e41-e660. doi:10.1161/CIR.0000000000001303
- Moonesinghe R, Yang Q, Zhang Z, Khoury MJ. Prevalence and Cardiovascular Health Impact of Family History of Premature Heart Disease in the United States: Analysis of the National Health and Nutrition Examination Survey, 2007-2014. J Am Heart Assoc. 2019;8(14):e012364. doi:10.1161/JAHA.119.012364
Addendum
Evidentiary Basis for the Inherited Hazard Coefficient Algorithm
Companion document to: “The Heart Health App That Finally Asks the Right Question”
Overview
The Inherited Hazard Coefficient (IHC) is computed using the formula:
H = Σ (R × W) / A
Where R is the relation coefficient (0.5 for first-degree relatives: parents and siblings; 0.25 for second-degree relatives: grandparents, aunts, and uncles), W is the severity weight of the cardiac event, A is the age at which the event occurred, and Σ represents summation across all affected relatives in the family history.
Each structural element of this formula — the relation coefficient R, the severity weight W, the age denominator A, and the summation logic — is grounded in a specific body of peer-reviewed cardiovascular epidemiology. This addendum identifies the primary literature supporting each component and distinguishes that evidence from the design choices that represent the author’s own evidence-informed synthesis.
The R Term: Relation Coefficient
The R term encodes the degree of biological relatedness between the patient and the affected family member. First-degree relatives (parents, siblings) receive a coefficient of 0.5, reflecting the 50% shared genome. Second-degree relatives (grandparents, aunts, uncles) receive 0.25, reflecting 25% shared genome. The differential weighting of first- versus second-degree relatives is supported by two landmark Framingham-based studies.
Lloyd-Jones et al., JAMA 2004
[1] This prospective Framingham offspring analysis was among the first to rigorously confirm parental cardiovascular disease as an independent predictor of offspring CVD after full adjustment for conventional risk factors. Critically, the study demonstrated that risk compounded when both parents were affected — the conceptual foundation for the summation structure of the IHC. The paper directly supports the assignment of the 0.5 coefficient to parents and the differential weighting of first-degree versus second-degree relatives.
Murabito et al., JAMA 2005
[2] This companion Framingham sibling analysis documented an unadjusted odds ratio of 2.46 for cardiovascular disease in individuals with an affected sibling — a magnitude comparable to or exceeding that of parental history in certain subgroups. This finding is the primary justification for assigning siblings the same R coefficient of 0.5 as parents, rather than a lower value. It also reinforced the core principle that first-degree relatives constitute a categorically different risk tier from second-degree relatives.
The A Term: Age at Event in the Denominator
The A term places the age at which the family member experienced their cardiac event in the denominator of the formula, so that younger events produce a higher IHC contribution. This is the most clinically consequential structural feature of the algorithm and is supported by consistent findings across multiple data sources.
Lloyd-Jones et al., JAMA 2004 and Murabito et al., JAMA 2005
[1],[2] Both Framingham analyses stratified their findings by age at the family event and demonstrated substantially elevated risk when the cardiac event was premature — defined as occurring before age 55 in male relatives and before age 65 in female relatives. A family event at age 40 carries a fundamentally different inherited signal than the same event at age 78. The A term in the denominator is a direct mathematical encoding of this well-established epidemiologic principle.
D’Agostino et al., Circulation 2008 — Framingham Risk Score
[3] Cited in the main article as the primary example of a risk calculator that does not account for age at the family event. The Framingham score uses the patient’s own chronological age as its dominant driver of 10-year risk, but incorporates no variable for the age at which family members experienced cardiac events. The A denominator in the IHC formula is specifically designed to correct for this gap — capturing what the Framingham score systematically omits.
The W Term: Severity Weight
The W term assigns differential weights to cardiac events based on their severity — with fatal events, sudden cardiac death, and early revascularization receiving higher weights than medically managed non-fatal events. This reflects the well-documented relationship between event severity and underlying atherosclerotic burden.
Villines et al., JACC 2011 — CONFIRM Registry
[4] This large multicenter CCTA registry demonstrated that even among patients with a CAC score of zero — conventionally considered low risk — a meaningful proportion harbored non-calcified, potentially obstructive plaque. The study provided strong evidence that event severity and plaque characteristics are not uniform across patients with nominally similar risk profiles. Fatal events in first-degree relatives imply a higher inherited plaque burden and more aggressive disease trajectory than non-fatal, medically managed events — the epidemiologic rationale for the W severity weighting.
Nerlekar et al., JAMA 2025 — CAUGHT-CAD Trial
[5] This 2025 randomized trial in patients with a family history of premature CAD demonstrated that non-calcified plaque burden varied substantially even among individuals within the same broad family history category. The trial used CCTA to quantify plaque progression as its primary endpoint, confirming that severity differentiation within the inherited risk spectrum has measurable clinical significance — and is not captured by binary family history classification or calcium scoring alone.
The Σ Term: Summation Across Relatives
The summation operator reflects the principle that inherited cardiac risk compounds with each additional affected relative. A patient with two affected first-degree relatives carries a meaningfully different inherited signal than a patient with one. The Σ structure encodes this dose-response relationship mathematically.
Bachmann et al., Circulation 2012 — Cooper Center Longitudinal Study
[6] This large prospective study of men followed over decades demonstrated that family history of coronary heart disease death was associated with significantly elevated long-term cardiovascular mortality, and that the risk accumulated across the follow-up period in a manner consistent with an underlying dose-response relationship. The study supports the logic of summing contributions across affected relatives rather than treating family history as a single binary flag.
Ference et al., European Heart Journal 2017
[7] This Mendelian randomization analysis demonstrated that the atherogenic effect of LDL cholesterol — the primary driver of inherited lipid-related cardiac risk — is cumulative and time-dependent. Lifetime exposure to elevated LDL produces atherosclerotic burden that is proportional to the integral of exposure over time, not simply to any single measurement. This biological framework supports the IHC summation structure: inherited cardiovascular risk is not a point estimate but a cumulative signal that should be aggregated across all affected relatives and weighted by the severity and timing of their events.
What the Literature Validates — and What It Does Not
What is validated
The peer-reviewed literature cited above establishes the following with high confidence:
- First-degree relatives confer greater inherited cardiac risk than second-degree relatives.
- Siblings carry risk comparable to parents, not intermediate between parents and grandparents.
- The age at which a family member experienced a cardiac event is a critical variable: premature events confer dramatically greater inherited signal than late-life events.
- Multiple affected relatives compound inherited risk in a dose-response fashion.
- Event severity correlates with underlying atherosclerotic burden and is not uniform across family history reports.
- Standard risk calculators systematically underutilize this information, particularly in younger patients with strong family histories.
What is not validated
The existing literature does not validate:
- The specific coefficient values chosen for R (0.5 and 0.25).
- The specific severity weight values assigned to W.
- The mathematical form of dividing by A rather than applying a categorical age-at-event modifier.
- The formula H = Σ(R×W)/A as a clinically calibrated predictive score for individual cardiovascular event risk.
- The IHC against any prospective outcome dataset.
The IHC formula is an evidence-informed educational framework that translates established epidemiologic principles into a structured, quantitative estimate of inherited familial cardiac risk. The inputs are grounded in landmark peer-reviewed literature. The specific mathematical implementation — the coefficient values, the weighting scheme, and the formula structure — represents the author’s synthesis of those principles and has not been independently validated. The ACC/AHA Primary Prevention Guideline [8] explicitly recognizes family history as a risk-enhancing factor that should modify clinical decision-making, but stops short of providing a quantitative formula for doing so. The IHC is designed to fill precisely that gap.
References
- Lloyd-Jones DM, Nam BH, D’Agostino RB Sr, et al. Parental cardiovascular disease as a risk factor for cardiovascular disease in middle-aged adults: a prospective study of parents and offspring. JAMA. 2004;291(18):2204-2211. doi:10.1001/jama.291.18.2204
- Murabito JM, Pencina MJ, Nam BH, et al. Sibling cardiovascular disease as a risk factor for cardiovascular disease in middle-aged adults. JAMA. 2005;294(24):3117-3123. doi:10.1001/jama.294.24.3117
- D’Agostino RB Sr, Vasan RS, Pencina MJ, et al. General cardiovascular risk profile for use in primary care: the Framingham Heart Study. Circulation. 2008;117(6):743-753. doi:10.1161/CIRCULATIONAHA.107.699579
- Villines TC, Hulten EA, Shaw LJ, et al. Prevalence and severity of coronary artery disease and adverse events among symptomatic patients with coronary artery calcification scores of zero undergoing coronary computed tomography angiography: results from the CONFIRM (Coronary CT Angiography Evaluation for Clinical Outcomes: An International Multicenter) registry. J Am Coll Cardiol. 2011;58(24):2533-2540. doi:10.1016/j.jacc.2011.10.851
- Nerlekar N, Vasanthakumar SA, Whitmore K, et al. Effects of Combining Coronary Calcium Score With Treatment on Plaque Progression in Familial Coronary Artery Disease: A Randomized Clinical Trial. JAMA. 2025;333(16):1403-1412. doi:10.1001/jama.2025.0584
- Bachmann JM, Willis BL, Ayers CR, Khera A, Berry JD. Association between family history and coronary heart disease death across long-term follow-up in men: the Cooper Center Longitudinal Study. Circulation. 2012;125(25):3092-3098. doi:10.1161/CIRCULATIONAHA.111.065490
- Ference BA, Ginsberg HN, Graham I, et al. Low-density lipoproteins cause atherosclerotic cardiovascular disease. 1. Evidence from genetic, epidemiologic, and clinical studies. A consensus statement from the European Atherosclerosis Society Consensus Panel. Eur Heart J. 2017;38(32):2459-2472. doi:10.1093/eurheartj/ehx144
- Arnett DK, Blumenthal RS, Albert MA, et al. 2019 ACC/AHA Guideline on the Primary Prevention of Cardiovascular Disease: A Report of the American College of Cardiology/American Heart Association Task Force on Clinical Practice Guidelines. Circulation. 2019;140(11):e596-e646. doi:10.1161/CIR.0000000000000678