
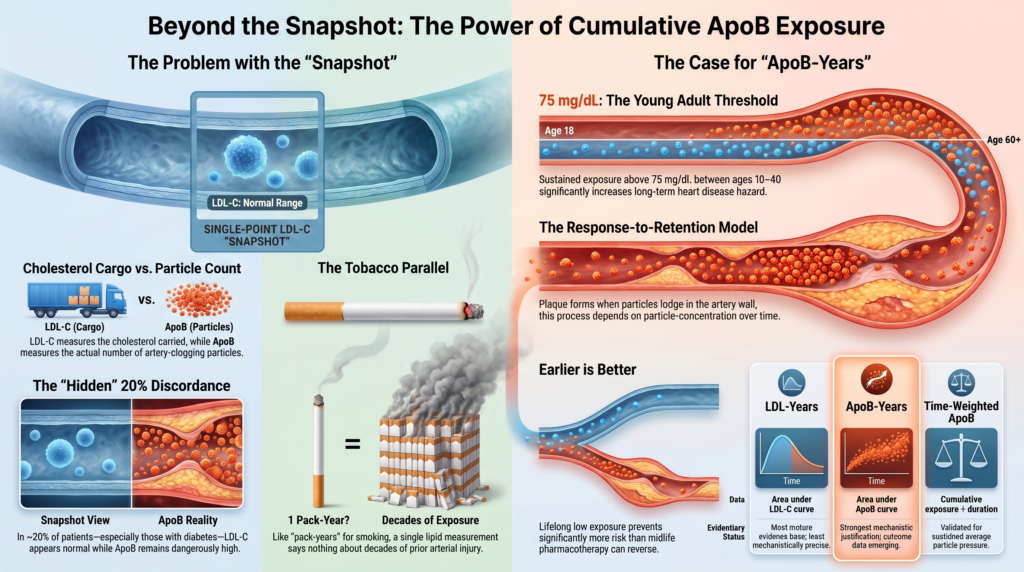
ApoB higher longer worse
Cumulative Apolipoprotein B Exposure
Biological Rationale, Human Evidence, Measurement Challenges, and a Proposed Research Framework
Abstract
Atherosclerotic cardiovascular disease (ASCVD) is a disease of cumulative exposure, yet it is still assessed almost exclusively with cross-sectional lipid measurements. A principal causal determinant of plaque is the number of apolipoprotein B (apoB)-containing lipoprotein particles that cross the endothelium and are retained in the arterial intima, integrated over time. That construct — apoB-years — is more mechanistically faithful than any single apoB value and more faithful than LDL-cholesterol (LDL-C) at any point in time, because LDL-C measures cholesterol cargo rather than particle count.
This review synthesizes four converging lines of human evidence: (1) longitudinal cohort data showing that cumulative LDL-C and cumulative apoB exposure predict incident ASCVD independent of contemporaneous lipid values; (2) discordance analyses showing that where apoB and LDL-C disagree, risk tracks more closely with apoB, with the prevalence and magnitude of that disagreement depending strongly on population, lipid phenotype, treatment status, and LDL-C estimation method; (3) imaging and pathology data linking cumulative exposure to plaque burden while distinguishing plaque burden from event risk; and (4) intervention data showing that intensive lowering of atherogenic lipoproteins, demonstrated principally through LDL-C-lowering interventions, arrests and partially reverses coronary atheroma along a dose-response curve in which no clear lower threshold has been identified within the range studied.
On that basis we define cumulative apoB exposure as a descriptive research measure, expressed in mg/dL·years, and set out explicitly why it cannot presently be converted into an individual risk estimate. Three constraints are decisive and are examined in turn: the published cumulative-exposure hazard ratios were derived from spline-based mixed models over a defined age window and describe a cohort-relative association, not an individual multiplier; a population-mean apoB slope cannot reconstruct an individual’s early-life trajectory; and trial-level associations between plaque change and event reduction cannot be transferred to individual patients. We treat apoB-years accordingly — as a candidate metric requiring derivation, calibration, and external validation — and close with the validation program that would be required before it could inform care.
1. The Problem With the Snapshot
Contemporary lipid management asks a chronically ill artery a single question at a single moment. A 52-year-old presenting with an LDL-C of 118 mg/dL is assigned a risk category, a treatment threshold, and a follow-up interval on the basis of a measurement that describes today. It says nothing about whether that person carried an LDL-C of 75 mg/dL for thirty years and drifted upward in the last three, or carried 160 mg/dL from adolescence and has just begun to decline. Those two arteries are not in the same condition, and no amount of statistical adjustment on the current value recovers the difference.
The parallel to tobacco exposure is conceptually useful, though biologically imperfect: pack-years is itself an imperfect index that does not capture inhalation depth, cessation timing, or nonlinear effects, and apoB exposure likewise interacts with arterial susceptibility and other risk factors. Still, the logic transfers. A single measurement of cigarettes smoked today is nearly uninformative; pack-years is the variable that carries prognostic weight. Cumulative lipoprotein exposure — “cholesterol-years,” “LDL-years,” or, mechanistically, more directly represented as “apoB-years” — is the cardiovascular analogue [1], [2], [3].
Three developments make this the right moment to formalize the metric. First, direct longitudinal data on cumulative apoB exposure now exist, not merely cumulative LDL-C [3]. Second, apoB assays are standardized, non-fasting, and generally low-cost in many health systems, and the 2026 ACC/AHA multisociety dyslipidemia guideline expands and more prominently integrates selective apoB measurement into routine assessment, building on the narrower risk-enhancer role already recognized in the 2018 guideline, which named apoB at or above 130 mg/dL a risk-enhancing factor and triglycerides at or above 200 mg/dL a relative indication for measuring it [4], [5], [6]. Third, the population in whom LDL-C misleads — the insulin-resistant and diabetic phenotype with cholesterol-depleted particles and triglyceride-rich remnants — is common and growing in contemporary primary-prevention populations.
2. Why Particle-Time, Not Cholesterol-Now, Is the Preferred Exposure Variable
2.1 Response-to-retention as a mass-action process
Atherogenesis begins when apoB-containing lipoproteins cross the endothelial barrier and are retained in the subendothelial matrix by ionic interaction between the basic residue clusters on apoB-100 and the negatively charged sulfated glycosaminoglycan chains of intimal proteoglycans — versican, biglycan, decorin [7], [8]. Retention precedes inflammation. It precedes monocyte recruitment, foam cell formation, and every cellular event that follows. This is the response-to-retention hypothesis, which was reinforced within a few years of its formulation [9] and remains the dominant mechanistic account of early atherogenesis in contemporary reviews [10].
The kinetic consequence is the point that matters clinically. If plaque mass depends on the number of particles retained, and retention depends on the number of particles presented to the endothelium per unit time, then plaque accumulation behaves as an integral rather than a snapshot. Transcytosis of apoB particles is receptor-mediated — scavenger receptor class B member 1 (SR-B1) and activin receptor-like kinase 1 (ALK1) have both been implicated — and is concentration-dependent [10].
The strength of that dependence should not be overstated. It is directionally concentration-dependent, not an exact one-to-one law in human coronary arteries: entry and retention are modified by endothelial permeability, arterial segment geometry and hemodynamics, particle size and composition, proteoglycan binding affinity, blood pressure, glycemic state, clearance from the intima, and existing plaque architecture. The defensible statement is that higher circulating apoB concentration increases the number of particles available for arterial entry and retention, and that integrated over time this increases cumulative retained burden, with the individual relationship modified by arterial-wall susceptibility.
2.2 Why apoB more directly represents atherogenic particle burden than LDL-C
Each hepatically derived VLDL, IDL, LDL, and Lp(a) particle contains one molecule of apoB-100, and routine total apoB assays may additionally detect apoB-48 on intestinally derived remnant particles. Because of that near one-to-one relationship, plasma apoB provides a standardized estimate proportional to the total concentration of atherogenic particles. It is worth being precise here: routine assays report apoB as a mass concentration in mg/dL, not as a molar particle count in nmol/L, and apoB-48 from intestinal particles, differences in apoB molecular mass, and assay calibration all introduce a margin between the measured mass and the true particle number. ApoB is a standardized proxy for particle burden, not literally a count. LDL-C, by contrast, measures the cholesterol carried inside LDL particles, which is a variable quantity: particles are cholesterol-depleted in insulin resistance, hypertriglyceridemia, and type 2 diabetes, and cholesterol-enriched in other states [11], [12].
This produces a systematic and predictable failure mode. Two patients with identical LDL-C can carry substantially different particle numbers, and the one with more particles has more objects capable of entering and lodging in the artery wall. Particle cholesterol content does not directly indicate the number of particles available for arterial entry and retention, though particle composition and size may modify their arterial behaviour. Cumulative apoB exposure therefore has the most direct mechanistic correspondence to atherogenic particle exposure; cumulative LDL-C exposure is a proxy for it that happens to have a longer epidemiologic track record because LDL-C was measured more often in the cohorts that ran longest.
This asymmetry — better construct, thinner direct data — is the honest state of the field and should be stated plainly in any clinical proposal built on it.
2.3 The exposure metrics, ranked
| Metric | Definition | What it captures | Evidentiary status |
| Current apoB | Single measured particle concentration | Present-day particle burden only | Well validated as a cross-sectional risk marker; risk generally tracks apoB when apoB and LDL-C are discordant, though incremental improvement over accurately estimated LDL-C or non-HDL-C varies by population [13] |
| Time-weighted average apoB | Cumulative exposure ÷ duration | Sustained average particle pressure, normalizing fluctuation | Cumulative/time-integrated exposure validated for LDL-C; direct apoB evidence emerging [3], [14] |
| LDL-years | Area under the LDL-C vs. age curve | Cumulative cholesterol cargo delivered to the wall | Most mature longitudinal evidence base; independent of midlife LDL-C [1], [14] |
| Non-HDL-years | Area under the non-HDL-C vs. age curve | All cholesterol within apoB particles, including remnants | Validated in young-adult studies of cumulative exposure to elevated non-HDL-C [15]; no direct comparative advantage over LDL-years has been demonstrated |
| ApoB-years | Area under the apoB vs. age curve | Integrated particle-time — direct proxy for subendothelial entrapment | Most direct mechanistic correspondence to atherogenic particle exposure; direct human outcome data emerging [3]. Not validated as a clinical metric. |
Table 1. Cumulative lipoprotein exposure metrics. The proposed ordering by mechanistic proximity places apoB-years highest, whereas LDL-years currently has the deepest longitudinal validation. Any clinical instrument must be honest about that inversion.
3. The Human Evidence for Cumulative Exposure
3.1 Cumulative LDL-C exposure: the mature evidence base
Domanski and colleagues analyzed 4,958 CARDIA participants enrolled at ages 18 to 30 and followed for a median of 16 years after age 40. Both the area under the LDL-C-versus-age curve and the time course of its accumulation independently predicted incident cardiovascular events after adjustment for sex, race, and traditional risk factors: hazard ratio 1.053 per 100 mg/dL·years of cumulative exposure (p < 0.0001), and hazard ratio 0.797 per mg/dL/year of slope (p = 0.045) [1]. The second coefficient is the more interesting one. A negative slope association means that the same total exposure accrued later in life was associated with lower subsequent risk than the same total accrued earlier. Time is not merely a multiplier on concentration; when in life the exposure occurs independently modifies risk.
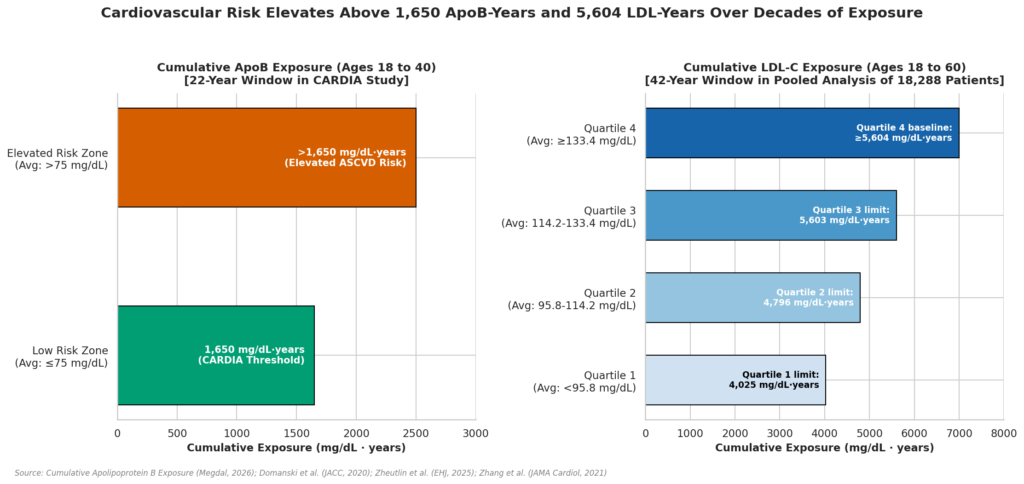
Zhang and colleagues extended this in a pooled analysis of 18,288 participants across four US cohorts, showing that cumulative LDL-C exposure from age 18 to 60 predicted incident coronary heart disease independent of the most recent midlife LDL-C value, with cumulative exposure quartiles spanning approximately <4,025, 4,025–4,796, 4,797–5,603, and ≥5,604 mg/dL·years [14]. Navar-Boggan and colleagues showed in the Framingham Offspring cohort that each decade of exposure to hyperlipidemia in young adulthood carried an adjusted hazard ratio of 1.39 for coronary heart disease after adjustment for non-HDL-C at age 55, and that 85% of young adults with prolonged hyperlipidemia would not have met statin criteria at age 40 under then-current guidelines [15].
That last figure illustrates an important limitation of current threshold-based approaches. A cumulative-exposure metric appears better suited to identifying people accumulating arterial injury who nonetheless remain below conventional treatment thresholds — precisely the group a current single-value threshold is structurally unable to flag.
| How these exposures were actually computed — a constraint on everything downstream
Domanski and colleagues did not sum measured values. They represented visits by age and fitted a nonparametric cubic spline-based mixed-effects model to estimate subject-specific LDL-C from age 18 to 40, borrowing information across the whole cohort. The CARDIA apoB analysis used an analogous spline mixed model with best linear unbiased prediction [1], [3]. The observation window was ages 18 to 40; the prediction window was ages 40 to 66. The hazard ratio of 1.053 per 100 mg/dL·years describes exposure accrued in the first window predicting events in the second. Any scheme that back-casts a single value, interpolates linearly, and integrates trapezoidally from sparse clinical panels is an unvalidated approximation of that method — not an implementation of it — and any coefficient applied outside the 18-to-40 accrual window is being used outside the conditions in which it was estimated. |
3.2 Cumulative apoB exposure: the direct evidence
The most important single study here analyzed 4,366 CARDIA participants with NMR-derived apoB concentration, LDL particle number (LDL-P), and triglyceride-rich lipoprotein particle number (TRL-P) across a 22-year exposure window from age 18 to under 40, with 241 ASCVD events over a mean 19.3 years of subsequent follow-up [3]. Each 1-standard-deviation higher cumulative apoB exposure was associated with an unadjusted hazard ratio of 1.53 (95% CI 1.36–1.72); after covariate adjustment the hazard ratio was approximately 1.30. Cumulative LDL-P and TRL-P behaved almost identically (unadjusted HRs 1.54 and 1.48).
Critically, the authors identified an inflection: ASCVD hazard began to rise above a usual apoB exposure of approximately 75 mg/dL sustained across ages 18 to under 40. They proposed apoB below 75 mg/dL as a goal for maintaining low risk in young adults. Expressed as an integral over that 22-year window, 75 mg/dL corresponds to an arithmetic equivalent of approximately 1,650 mg/dL·years (75 × 22) — a transformation of the reported reference level, not a separately derived cut-point.
| What that 1,650 figure is, and is not
It IS: a cohort-specific, spline-derived reference point around 75 mg/dL, above which estimated event hazard became more clearly elevated over one specific age window, using NMR-derived apoB. It is NOT: a validated threshold for the appearance of first plaque, for calcification, for high-risk plaque morphology, or for first myocardial infarction. It is NOT: transferable without assumption to immunoassay apoB, to other age windows, or to populations with different risk-factor profiles. To present this number as a clinical cut-point without that framing would be to overstate it. |
Trajectory variability is substantial and must be modeled, not assumed away. In 3,055 CARDIA participants measured at five exams over 30 years, the mean annualized rate of apoB change was 0.52 mg/dL/year (SD 1.0), but individual rates ranged from −6.26 to +9.21 mg/dL/year [16]. A single-point back-extrapolation from a midlife value is therefore an approximation with a wide error band, and any instrument built on it must display that uncertainty rather than hide it behind a point estimate.
3.3 Prediction in young adults specifically
In a pooled analysis of 10,519 adults from US community-based cohorts, apoB was more strongly associated with ASCVD in adults aged 18 to 39 than in those aged 40 or older, and adding apoB to the PREVENT equations improved risk reclassification in the younger group (continuous NRI 0.67, 95% CI 0.23–1.09, for 10-year risk and 0.47, 95% CI 0.02–0.84, for 30-year risk) but not in the older group [17]. The authors were appropriately cautious that these improvements were modest. Nonetheless the directional signal is consistent: the younger the patient, the more the single measurement understates the lifetime problem, and the stronger the rationale for testing whether a cumulative framing adds predictive information.
4. Discordance: The Strongest Practical Argument for apoB
4.1 How much discordance, actually
Discordance is the situation in which apoB and LDL-C place a patient in different risk categories. Because the two are strongly correlated in most patients, conventional regression cannot cleanly separate their predictive contributions; in a large clinical-practice cohort, apoB and NMR-measured LDL particle number were themselves highly correlated (R² = 0.79) [18]. Discordance analysis is the methodological answer, and it comes in three flavors: discordance by clinical cut-points, by population percentiles, and by regression residuals [19].
The prevalence estimates cluster in a defensible range, and the working figure of roughly 20% is reasonable as an upper-middle estimate for at-risk populations, though it should be stated as a range rather than a point value.
| Source | Population and definition | Discordance estimate |
| De Oliveira-Gomes et al., Circulation 2024 [13] | Review across cohorts; discordantly high apoB by varying definitions | 5.3% to 24.9%, depending on definition and population |
| CARDIA apoB trajectory analysis, J Lipid Res 2022 [16] | Higher or lower than average apoB for a given non-HDL-C | Approximately 8% to 20% |
| CARDIA young-adult discordance vs. CAC [20] | apoB at mean age 25 more predictive of later CAC than LDL-C or non-HDL-C | 18% of young adults |
| Health Diagnostic Laboratory cohort, n = 412,013 [18] | apoB vs. NMR LDL-P by clinical cut-points | 5%–6% flagged by LDL-P alone; 6%–7% by apoB alone |
| Copenhagen General Population Study, n = 95,108 [21] | Excess apoB (measured minus LDL-C-predicted) ≥11 mg/dL | Graded strata across the full LDL-C spectrum |
Table 2. Reported prevalence of clinically meaningful apoB/LDL-C discordance. The spread reflects genuine methodological heterogeneity in how discordance is defined, not disagreement about whether it exists.
4.2 Does apoB win when they disagree?
A systematic review of published discordance analyses assembled 15 studies and 593,354 participants, diverse populations, treated and untreated, using median-based, percentile-based, residual-based, and variance-based definitions. ApoB outperformed LDL-C in 9 of 9 comparisons. ApoB outperformed non-HDL-C in 7 of 9, tied in 1, and lost in 1. LDL particle number outperformed LDL-C in 2 of 3 [22]. That is about as one-directional a literature as preventive cardiology produces.
The Copenhagen General Population Study operationalized discordance as “excess apoB” — measured apoB minus the apoB predicted from LDL-C alone, with the prediction derived from individuals with triglycerides ≤1 mmol/L. Among 53,484 women and 41,624 men not taking statins, followed a median 9.6 years with 2,048 myocardial infarctions and 4,282 ASCVD events, excess apoB was associated dose-dependently with risk across the entire LDL-C spectrum [21]. The hazard ratios from that analysis are reproduced in Table 3 because they are the empirical anchor for the discordance discussion in Section 8.
| Excess apoB (mg/dL) | ASCVD HR, women | ASCVD HR, men | Interpretation |
| <11 (reference) | 1.00 | 1.00 | Concordant |
| 11–25 | 1.08 (0.97–1.21) | 1.14 (1.02–1.26) | Mild discordance |
| 26–45 | 1.30 (1.14–1.48) | 1.41 (1.26–1.57) | Moderate discordance |
| 46–100 | 1.34 (1.14–1.58) | 1.41 (1.25–1.60) | Marked discordance |
| >100 | 1.75 (1.08–2.83) | 1.52 (1.13–2.05) | Severe discordance |
Table 3. Multivariable-adjusted ASCVD hazard ratios by excess apoB stratum, Copenhagen General Population Study [21]. Results were robust across the entire LDL-C spectrum.
4.3 The insulin-resistant and diabetic phenotype
Discordance is not randomly distributed. It concentrates, predictably and mechanistically, in a metabolic phenotype that is common in contemporary primary-prevention populations.
In insulin resistance and type 2 diabetes, hepatic VLDL overproduction and impaired lipolysis generate a triglyceride-rich pool. Cholesteryl ester transfer protein exchanges triglyceride into LDL and HDL in return for cholesteryl ester; hepatic lipase then hydrolyzes the triglyceride-enriched LDL, yielding small, dense, cholesterol-depleted LDL particles. The result is a high particle number carrying a normal or even low cholesterol mass. LDL-C reads reassuringly. ApoB does not [11], [12].
Distribution data make the magnitude concrete. In a nationally representative NHANES sample of statin-naive US adults, at an LDL-C of 100 mg/dL half the population had an apoB between 75 and 86 mg/dL (the interquartile range), and an LDL-C of 70 mg/dL corresponded to a median apoB of about 60 mg/dL [23]. Greater positive discordance — higher measured than expected apoB — was associated with older age, male sex, obesity, diabetes, higher triglycerides, higher HbA1c, statin use, and poor metabolic health. Notably, variability within these subgroups exceeded the between-group differences, which is an argument for measuring apoB rather than for inferring it from phenotype.
The mechanism extends past particle count into retention kinetics. Insulin resistance stimulates vascular smooth muscle synthesis of proteoglycans with hyperelongated glycosaminoglycan chains, increasing the density of negative charge in the intimal matrix and its avidity for apoB [8]. Direct measurement supports enhanced retention: the interstitial-fluid-to-serum ratio of apoB is significantly lower in type 2 diabetes than in controls, consistent with greater subendothelial entrapment rather than lymphatic clearance [24]. These findings support the possibility that diabetes raises risk through both a greater particle burden per unit of cholesterol and arterial-wall changes that may favour retention once particles arrive.
Discordantly high apoB is also independently associated with prevalent chronic kidney disease in cross-sectional data. In 13,767 NHANES participants, those with low LDL-C and high apoB had the strongest association with prevalent CKD (OR 1.12, 95% CI 1.08–1.16) relative to the concordant-low group, alongside the highest fasting glucose, insulin, and HOMA-IR values [25].
4.4 The strongest counterargument, stated fairly
The 2026 multisociety guideline makes a methodological point that any advocate of apoB must confront directly: when LDL-C is estimated with the Martin/Hopkins equation rather than the Friedewald formula, the measured prevalence of LDL-C/apoB discordance falls markedly [4]. A meaningful share of measured historical discordance was attributable to a 1972 estimating equation that assumes a fixed triglyceride-to-VLDL-cholesterol ratio of 5:1 — an assumption that fails precisely in the hypertriglyceridemic, insulin-resistant patients where discordance was reported to be greatest.
This does not dissolve the case for apoB, but it does resize it. The honest position is that part of the historical discordance signal reflected LDL-C estimation method rather than particle biology, while part reflects genuine biological discordance, and that the residual real discordance is smaller than the older literature implies. The direct measurement argument survives intact: apoB requires no estimating equation, is unaffected by fasting status, and is analytically standardized. A second counterargument deserves the same candor — the ATTICA cohort found that elevated apoB independently predicted 20-year ASCVD risk, but principally in the presence of concomitantly elevated LDL-C, which tempers the claim that apoB routinely rescues risk that LDL-C misses entirely [26].
5. From Exposure to Plaque
The link from cumulative exposure to anatomical disease rests on autopsy pathology, longitudinal imaging cohorts, and intervention trials.
The PDAY (Pathobiological Determinants of Atherosclerosis in Youth) investigators established that atherosclerosis begins in childhood and that conventional risk-factor scores correlate with the earliest anatomically demonstrable lesions in people aged 15 to 34, not merely with advanced disease [27]. In the primary PDAY autopsy series of 1,079 men and 364 women aged 15 through 34 who died of external causes, the extent of intimal surface involved by fatty streaks and raised lesions in the aorta and right coronary artery rose with age, was positively associated with VLDL-plus-LDL cholesterol concentration, and was negatively associated with HDL cholesterol [28]. The Bogalusa Heart Study showed that the extent of aortic and coronary fatty streaks and fibrous plaques rose with the number of risk factors present, including LDL-related measures [29]. These are the observations that make a lifetime-exposure framing biologically well supported rather than merely elegant.
Longitudinal imaging bridges youth exposure to midlife anatomy. In CARDIA, PDAY risk scores measured in young adulthood predicted coronary and abdominal aortic calcium two decades later [30]. In the Cardiovascular Risk in Young Finns cohort, adolescent risk-factor exposure predicted coronary artery calcium in adulthood [31]. Neither study computed apoB-years, but both are consistent with cumulative burden as the operative variable.
ApoB-specific plaque associations exist. In MESA, over a median 9.4 years, top-quartile apoB was associated with carotid plaque progression after adjustment for LDL-C or for total and HDL cholesterol, though the association lost significance when all lipid covariates were included together (p = 0.086) — a signal, not an independent one [32]. In the Atherosclerosis and Insulin Resistance (AIR) study, a high apoB/apoA-I ratio was associated with a greater three-year progression rate of carotid intima-media thickness in clinically healthy 58-year-old men [33].
| The gap that must be acknowledged
There is no validated apoB-years threshold for: first detectable plaque, early fibroatheroma, positive remodeling, onset of calcification, high-risk plaque morphology, or first myocardial infarction. Published tables assigning specific apoB-year or LDL-year values to these milestones circulate widely in secondary and online sources. Those figures do not trace to primary peer-reviewed derivations and should not be reproduced in a clinical instrument. The defensible position is that each individual has, in effect, a personal plaque threshold — cumulative exposure interacts with inherited arterial susceptibility, blood pressure, glycemia, smoking, renal function, inflammation, and Lp(a), so the exposure at which plaque appears varies substantially between individuals. |
6. Plaque Burden Is the Substrate; Events Require a Trigger
Conflating plaque burden with event risk is a common conceptual error, and any proposed metric must keep the distinction explicit. Plaque accumulation is a graded, concentration-dependent process, though a heterogeneous and probabilistic one: two people with the same cumulative exposure may accumulate substantially different plaque depending on blood pressure, smoking, glycemia, genetics, Lp(a), arterial geometry, inflammation, and local endothelial biology. Acute events are threshold-crossing phenomena requiring a vulnerable lesion, a mechanical or inflammatory trigger, and a thrombogenic milieu.
PROSPECT demonstrated that future events frequently arose from lesions that were angiographically mild at baseline — mean diameter stenosis around 32% — but which carried large plaque burden, small luminal area, or thin-cap fibroatheroma morphology on intravascular imaging [34]. PROSPECT II showed that lipid-rich plaques with large plaque burden independently predicted nonculprit-lesion events: patients harbouring at least one lesion with both a large plaque burden and a large lipid core had a four-year nonculprit-lesion-related MACE rate of 13.2%, while the corresponding lesion-level rate was 7.0% [35]. That distinction matters, and the figure cuts both ways: it is clinically meaningful, and it also means the great majority of high-risk lesions did not cause an event over four years.
On CT angiography, SCOT-HEART established low-attenuation plaque burden as the strongest predictor of subsequent myocardial infarction, adding value beyond calcium score and obstructive stenosis [36]. In a later SCOT-HEART analysis, low-attenuation plaque burden above 4% carried a hazard ratio of 4.87 for fatal or nonfatal MI and pericoronary adipose tissue attenuation a hazard ratio of 2.45, with the two combined identifying the highest-risk group and raising the area under the curve from 0.71 for low-attenuation plaque alone to 0.75 for the combination [37]. Acute coronary syndromes arise variously from plaque rupture, plaque erosion, and calcified nodules; erosion in particular may occur with modest plaque burden and near-normal angiographic appearance, but still on an atherosclerotic substrate [38].
Two corrections to how this is often summarized are worth making. First, the relation is best stated as a heuristic rather than a model: plaque burden defines the anatomical substrate and strongly constrains event probability, while lesion phenotype, local biomechanical stress, systemic inflammation, and thrombogenicity influence whether and when an acute event occurs. Writing it as a product of three terms is a useful diagram, not an established quantitative relationship, and it should not be presented as one.
Second, emphasizing vulnerability can understate how powerfully total plaque burden itself predicts events. Modern imaging data place total burden among the strongest available predictors, and the reason is straightforward arithmetic: the more plaque a person carries, the more lesions exist that could rupture or erode, the greater the probability that at least one has adverse morphology, the larger the inflamed and thrombogenic arterial surface, and the higher the likelihood of obstructive progression. The chain is best written as cumulative apoB exposure → plaque burden and plaque phenotype → number and phenotype of lesions → probability of an event. This chain is a causal framework rather than a validated quantitative mediation model. Cumulative exposure relates strongly to lifetime event risk; it is far less able to say which plaque will produce an event next year.
7. Regression: Can Cumulative Exposure Be Repaid?
The clinical appeal of an exposure metric depends partly on whether reducing forward accrual does anything to existing disease. The intravascular imaging trials answer this affirmatively, with an important correction to a claim that appears frequently in secondary sources.
GLAGOV randomized 968 patients with symptomatic coronary disease to evolocumab or placebo on background statin therapy. Mean achieved LDL-C in the evolocumab arm was 36.6 mg/dL, and percent atheroma volume changed by −0.95% versus no significant change on statin plus placebo [39]. That −0.95% is a treatment-group mean, with substantial individual heterogeneity; it does not mean every participant regressed. PACMAN-AMI added alirocumab to high-intensity statin after acute myocardial infarction and, using serial IVUS, NIRS, and OCT, found “triple regression” — simultaneous reduction in percent atheroma volume, reduction in maximum lipid core burden index, and increase in minimum fibrous cap thickness — in 40.8% of the alirocumab arm versus 23.0% of placebo (p = 0.002), with the triple-regression group achieving a mean LDL-C of 38.4 mg/dL versus 55.7 mg/dL [40].
| Correction to a widely repeated claim
A figure of 70 mg/dL is often cited as the achieved LDL-C “threshold” below which coronary plaque regression becomes pronounced. The primary data do not support a threshold. Post hoc analysis of GLAGOV showed coronary plaque regression in direct proportion to achieved LDL-C, with no evident change in slope down to approximately 20 mg/dL; related analyses of intensive PCSK9 inhibition, including HUYGENS in acute coronary syndromes, are consistent with continued plaque benefit at very low achieved LDL-C [39], [41]. The correct statement is narrower: within the achieved LDL-C range studied, these analyses did not identify a clear lower threshold or change in slope for plaque regression. That is what was observed; it is not proof that benefit remains perfectly linear indefinitely, or that every patient benefits equally at the lowest achieved levels. |
At the trial level, regression appears to track outcomes. A systematic review and meta-regression of 17 prospective dyslipidemia-therapy studies (6,333 patients) reported that a 1% decrease in mean percent atheroma volume was associated with a 20% lower MACE risk (adjusted OR 0.82, 95% CI 0.70–0.95, p = 0.011) [42]. That association is between trial-level means. It does not license the inference that lowering an individual patient’s atheroma volume by 1% reduces that patient’s event risk by 20% — that would be an ecological-to-individual extrapolation. Whether apoB-years trajectory change correlates with serial plaque-volume change, and whether that change mediates clinical benefit, remains an open question for the validation program in Section 11.
Two caveats bound the optimism. Regression of plaque volume is modest in absolute terms and demonstrated over one to two years in patients with established disease; it is not extrapolable to the reversal of decades of accumulated burden. And the genetic evidence establishes an asymmetry that no regression trial can overcome: lifelong genetically determined lower LDL-C confers a risk reduction several-fold larger than the same magnitude of reduction achieved by midlife pharmacotherapy over five years [43]; Mendelian-randomization evidence supports the same lifetime-exposure logic for apoB specifically [44]. Exposure prevented is worth more than exposure treated. That asymmetry is the entire argument for measuring cumulative exposure early rather than reacting to a threshold crossing late.
8. Cumulative apoB Exposure as a Descriptive Metric — and the Barriers to Individual Risk
This section defines what can be computed from a person’s apoB history, and states with equal precision what cannot yet be computed from it. The distinction is the crux of the paper: a descriptive exposure quantity is defensible; an individual risk score derived from it is not.
8.1 The descriptive quantity
ABY = ∫ apoB(t) dt over a defined age window (mg/dL·years)
Cumulative apoB exposure is a legitimate descriptive quantity: the area under an individual’s apoB-versus-age curve over a stated window. It should be computed from measured serial apoB wherever possible, reported for the age window over which it was actually measured, and accompanied by the proportion of the integral that rests on measurement rather than imputation. Exposure derived from imputed apoB should be reported separately and never blended into a single headline figure, because the imputation assumes population-median particle-to-cholesterol behaviour — precisely the assumption that fails in the discordant patients the metric is meant to identify.
A comparison against the CARDIA-derived reference of roughly 75 mg/dL is interpretable within ages 18 to 40, the window in which that spline-derived reference point was observed. Beyond age 40 the reference has no anchoring: nothing establishes that 75 mg/dL is the appropriate comparator at 55, 70, or 85, that a person slightly above it has meaningfully accrued exposure debt, that 75 represents a biological zero-risk value, or that the relationship holds constant after age 40. The source describes this level as one that may represent a goal for young adults — materially weaker than a lifetime denominator.
8.2 Why the exposure cannot be turned into a risk multiplier
The natural temptation is to take a published cumulative-exposure hazard ratio — such as Domanski’s 1.053 per 100 mg/dL·years of cumulative LDL-C exposure — and exponentiate it across an individual’s lifetime to produce a personal risk multiplier. That step is invalid, for several independent reasons, any one of which is sufficient.
- A Cox hazard ratio is defined relative to a modelled comparison and the study’s baseline hazard. Exponentiating it from zero lifetime exposure implies a comparator — a person who accrued no atherogenic particle exposure at all — that does not physiologically exist, and it ignores the model intercept, covariate distribution, competing risks, and cohort calibration.
- Even anchored to a non-zero reference rather than to zero, the result is a cohort-relative association under the original model’s assumptions, not a patient-level multiplier, and it cannot be attached to a validated instrument such as PREVENT.
- The coefficient was estimated over exposure accrued from ages 18 to 40 predicting events from 40 to 66. Applied to exposure accrued across a whole lifetime, it is used outside the conditions of its derivation.
- Producing the multiplier would require translating apoB-years into LDL-years using a population-level relationship — the very relationship this paper argues fails in the individuals the metric exists to identify.
No event-risk multiplier should be produced from cumulative apoB exposure until one is derived directly, in a cohort with serial apoB, and externally validated.
8.3 Why a single measurement cannot be back-cast to age 18
Most patients present without adolescent lipid data, which invites reconstructing the early trajectory from a later value using a population-average annual apoB slope. This does not work at the individual level.
- A population mean is not an individual trajectory. Applied backwards across decades, it produces regression-to-the-mean error in anyone whose apoB moved for a specific reason — weight change, diabetes onset, menopause, therapy initiation or discontinuation, thyroid or renal disease.
- The standard deviation of observed across-person slopes is not the standard error of a person-specific back-cast. Multiplying an across-person SD across decades yields a wide interval, but not a properly estimated prediction interval.
The CARDIA apoB trajectory analysis reached this conclusion directly: the substantial variance in apoB over time, and the modest association between baseline measures and rates of change, mean that predicting an individual’s future apoB concentration — and therefore their cumulative exposure — from a one-time assessment has low accuracy [16]. Where early measurements are absent, the appropriate output is a set of clearly labelled sensitivity scenarios — a stable lifelong level, a gradual age-related rise, a late metabolic deterioration — presented side by side as sensitivity analyses rather than as competing estimates of the person’s actual history. A single reconstructed central estimate should not be produced.
8.4 Why discordance hazard ratios cannot simply be borrowed or combined
The Copenhagen excess-apoB hazard ratios (Section 4.2) are a real and useful signal, but two constraints govern their use. First, they are defined relative to a specific residual: Copenhagen derived expected apoB by regressing apoB on LDL-C, separately in women and men, among participants with triglycerides at or below 1 mmol/L (89 mg/dL). The category cut-points and their hazard ratios are defined against that residual, so substituting a different expected-apoB equation would change who falls into each category, and the hazard ratios would no longer describe the patients being classified. Any use of the Copenhagen categories must reproduce its actual sex-specific regressions, not an approximation of them.
Second, the Copenhagen hazard ratios must not be multiplied by the Domanski cumulative-exposure hazard ratio to build a composite. The two exposures overlap biologically and statistically; multiplying them assumes independence and double-counts the same particle-related risk. A joint estimate would require both variables entered in a single model, with collinearity and interaction assessed, cohort-specific calibration, and external validation — not a product of two hazard ratios drawn from different cohorts.
8.5 Why plaque change cannot be converted into individual event reduction
The trial-level association between mean plaque regression and mean event reduction (Section 7) is ecological. It relates group averages across trials. It does not establish that lowering a particular patient’s atheroma volume by one percentage point reduces that patient’s event risk by any fixed amount, it does not transfer outside the studied populations and treatments, and it assumes plaque-volume change captures the whole treatment effect. Translating it into an individual event projection is an ecological-to-individual error. Whether apoB-years trajectory change correlates with serial plaque-volume change, and whether that change mediates clinical benefit, is a question for the validation program in Section 11, not a calculation to perform today.
8.6 What a research index may and may not contain
A limited research index of the form above — cumulative measured apoB exposure over a defined window, reported with its measured-versus-imputed share and, within ages 18 to 40, a ratio against the CARDIA reference — is a reasonable object to define and then test. What it must not contain, until each is separately derived and validated, is an event-risk multiplier, a composite of overlapping hazard ratios, a back-cast central estimate, a projected plaque or event trajectory, or clinical risk categories carrying recommended actions. Candidate exposure bands may be prespecified for the purpose of testing them, but a research analysis plan is better served by predefining quantiles or continuous spline terms than by inventing labelled categories that will be read as validated risk tiers regardless of any disclaimer attached.
9. Validation Status: What This Is Not
This section states plainly what the descriptive measure is not, so that no reader mistakes it for a validated risk instrument.
- Neither apoB-years nor LDL-years is a validated clinical metric. No guideline reviewed in Section 10 operationalizes or endorses a cumulative-exposure calculation for routine care.
- Any candidate exposure bands are constructed by reasoning outward from a single cohort reference point observed over ages 18 to 40. They have never been tested against outcomes, and this paper attaches no clinical action to them.
- Back-casting a person’s early exposure carries uncertainty that in many patients would exceed the width of any candidate band. This is the single largest technical barrier to a retrospective cumulative-exposure measure, and it is not solvable with better statistics — it requires lipid data that most adults do not have.
- Any apoB-to-LDL-C conversion assumes population-median behaviour in an individual — precisely the assumption that fails in the discordant patients the metric exists to identify. Imputed exposure must therefore be reported separately from measured exposure rather than blended with it.
- Cumulative exposure computed by trapezoidal integration from sparse clinical panels is not the quantity the published hazard ratios describe. Those were derived from spline-based mixed models that borrowed information across an entire cohort. The two have never been compared.
- Cumulative exposure is biologically and epidemiologically linked to anatomical disease burden, but its ability to predict an individual’s plaque trajectory has not been directly validated, and it is particularly limited for predicting the timing of clinical events. The measure proposed here should not substitute for imaging where imaging is independently clinically indicated for anatomical risk assessment.
The appropriate positioning is therefore a descriptive research measure that makes visible a variable clinicians already believe matters, considered alongside — never instead of — the validated instruments (the PREVENT equations, guideline lipid goals, and coronary artery calcium or CT angiography where independently indicated). It should not carry a risk estimate, a category label, or a recommended action until each has been derived and externally validated.
10. Guideline Trajectory
Guideline movement supports the cumulative-exposure concept. It does not validate apoB-years arithmetic, historical back-casting, exposure ratios, or exposure-based treatment thresholds, and the distinction should be kept sharp.
The 2026 ACC/AHA/multisociety dyslipidemia guideline retires and replaces the 2018 cholesterol guideline and is retitled to reflect atherogenic lipoproteins beyond LDL-C, including triglyceride-rich remnants and Lp(a) [4]. It replaces the Pooled Cohort Equations with the PREVENT-ASCVD equations, which estimate both 10-year and 30-year risk — an explicitly lifetime-oriented framing. It restores absolute LDL-C goals by risk stratum (<100, <70, and <55 mg/dL). It recommends Lp(a) measurement at least once in every adult’s lifetime. It endorses selective apoB measurement to assess residual atherogenic particle burden, particularly in patients with triglycerides above 200 mg/dL, diabetes, or achieved LDL-C below 70 mg/dL. And its central framing — earlier intervention to reduce prolonged exposure — is the cumulative-exposure argument in all but name [5], [45].
The 2024 National Lipid Association expert consensus went further on apoB specifically, proposing apoB thresholds of 60, 70, and 90 mg/dL for very-high-, high-, and borderline-to-intermediate-risk patients respectively, and stating that apoB and non-HDL-C stratify risk more accurately than LDL-C where the measures disagree [46]. The 2019 ESC/EAS guidelines give apoB a Class I, Level C recommendation for risk assessment, preferentially in metabolic syndrome, diabetes, obesity, and very low achieved LDL-C, and permit its use as the primary measurement for screening, diagnosis, and management [47]. The Canadian Cardiovascular Society similarly recommends apoB or non-HDL-C as preferred screening markers in hypertriglyceridemia [48].
None of the societies or guidelines reviewed here operationalizes a cumulative-exposure calculation. The biology is increasingly accepted; the arithmetic has not been derived, calibrated, or validated. That gap is what the research program in Section 11 is meant to close, and it is not closed by proposing a formula.
11. A Validation Program
The following would move apoB-years from concept to instrument, in ascending order of cost.
Tier 1 — Retrospective derivation in existing cohorts
Candidate cohorts include CARDIA, MESA, Framingham Offspring, the Copenhagen General Population Study, and UK Biobank. Suitability would depend on the availability, timing, assay method, and density of serial apoB measurements and stored specimens, which differ substantially between them and must be established from each cohort’s own data documentation before that cohort is committed to this analysis. Where that condition is met, compute cumulative exposure using measured serial apoB only, by the same spline-based mixed-model approach used in the source analyses, and separately by trapezoidal integration from a deliberately thinned subset of visits that mimics real clinical density. Comparing those two is itself a necessary study: it establishes whether a clinically computable approximation recovers the quantity the published hazard ratios describe. Then test discrimination and calibration for incident ASCVD against the current-value model, quantifying incremental C-statistic, net reclassification, and integrated discrimination over PREVENT. The null hypothesis to be defeated is that cumulative exposure adds nothing beyond current apoB plus age.
Tier 2 — Back-cast validation
Within cohorts holding true adolescent measurements, compare back-cast estimates against measured values to derive empirical error bands by age gap and by covariate profile. This is the study that determines whether a retrospective exposure estimate is viable at all in patients presenting after age 45, and it may be feasible in existing cohorts holding sufficiently dense adolescent and adult measurements.
Tier 3 — Anatomical anchoring
In cohorts with repeat quantitative coronary CTA — the PARADIGM registry, a prospective multinational registry of patients undergoing serial CCTA, is the clearest established example [49], and any further cohort, including SCAPIS or MESA, would first have to be shown to hold repeat quantitative CCTA suitable for measuring plaque-volume change — regress plaque volume and low-attenuation plaque volume on ABY to establish whether the milestone thresholds that currently circulate without provenance have any empirical basis. This is where the vacant cells of every published apoB-years milestone table would finally be filled with real numbers.
Tier 4 — Prospective and interventional
Prospective registry deployment measuring whether reporting cumulative apoB exposure changes physician prescribing, patient adherence, and downstream lipid trajectory; ultimately, a randomized comparison of exposure-guided versus guideline-goal-guided management with imaging or event endpoints. Only the last of these can establish that the metric improves outcomes rather than merely predicting them.
12. Conclusion
The case for cumulative apoB exposure rests on four claims of sharply differing strength. That plaque accumulation is strongly related to both the magnitude and the duration of exposure to apoB-containing particles — integration over time being a biologically motivated approximation of that cumulative exposure — is well supported by mechanism and consistent with the available human data. That cumulative exposure predicts ASCVD independent of contemporaneous lipid values is demonstrated in multiple cohorts for LDL-C and in one important CARDIA analysis for apoB. That risk tracks apoB more closely than LDL-C where the two disagree — in a fraction of adults that varies from roughly 5% to 25% by definition, treatment status, and LDL-C estimation method, concentrating in the insulin-resistant and diabetic phenotype — is supported consistently across the available discordance analyses. That a specific cumulative-exposure number should guide a specific clinical decision is not established at all, and the distance between the third claim and the fourth is larger than enthusiasm for the concept tends to suggest.
The productive path is to treat cumulative apoB exposure as a candidate metric requiring derivation, calibration, and external validation, and to resist the temptation to publish coefficients before they exist. A disclaimer does not make an invalid calculation valid. At the same time, the status quo is not neutral: current practice necessarily relies primarily on contemporaneous measurements despite the chronic, cumulative nature of atherosclerosis, and does so in a population increasingly composed of patients whose LDL-C understates their particle burden — a limitation with a known direction. Both statements are true, and the second does not license shortcuts on the first.
References
- Domanski MJ, Tian X, Wu CO, et al. Time Course of LDL Cholesterol Exposure and Cardiovascular Disease Event Risk. J Am Coll Cardiol. 2020;76(13):1507-1516. doi:10.1016/j.jacc.2020.07.059
- Shapiro MD, Bhatt DL. “Cholesterol-Years” for ASCVD Risk Prediction and Treatment. J Am Coll Cardiol. 2020;76(13):1517-1520. doi:10.1016/j.jacc.2020.08.004
- Zheutlin AR, Handoo F, Luebbe S, et al. Cumulative exposure to atherogenic lipoprotein particles in young adults and subsequent incident atherosclerotic cardiovascular disease. Eur Heart J. 2025;46(41):4302-4312. doi:10.1093/eurheartj/ehaf472
- Writing Committee Members, Blumenthal RS, Morris PB, et al. 2026 ACC/AHA/AACVPR/ABC/ACPM/ADA/AGS/APhA/ASPC/NLA/PCNA Guideline on the Management of Dyslipidemia: A Report of the American College of Cardiology/American Heart Association Joint Committee on Clinical Practice Guidelines. Circulation. 2026;153(17):e1154-e1276. doi:10.1161/CIR.0000000000001423
- Lower sooner: how the 2026 dyslipidemia guideline changes practice. Cardiology Magazine. American College of Cardiology; July 2026. Accessed August 10, 2026.
- Grundy SM, Stone NJ, Bailey AL, et al. 2018 AHA/ACC/AACVPR/AAPA/ABC/ACPM/ADA/AGS/APhA/ASPC/NLA/PCNA Guideline on the Management of Blood Cholesterol: A Report of the American College of Cardiology/American Heart Association Task Force on Clinical Practice Guidelines. Circulation. 2019;139(25):e1082-e1143. doi:10.1161/CIR.0000000000000625
- Williams KJ, Tabas I. The response-to-retention hypothesis of early atherogenesis. Arterioscler Thromb Vasc Biol. 1995;15(5):551-561. doi:10.1161/01.atv.15.5.551
- Tabas I, Williams KJ, Borén J. Subendothelial lipoprotein retention as the initiating process in atherosclerosis: update and therapeutic implications. Circulation. 2007;116(16):1832-1844. doi:10.1161/CIRCULATIONAHA.106.676890
- Williams KJ, Tabas I. The response-to-retention hypothesis of atherogenesis reinforced. Curr Opin Lipidol. 1998;9(5):471-474. doi:10.1097/00041433-199810000-00012
- Kumarapperuma H, Chia ZJ, Malapitan SM, Wight TN, Little PJ, Kamato D. Response to retention hypothesis as a source of targets for arterial wall-directed therapies to prevent atherosclerosis: A critical review. Atherosclerosis. 2024;397:118552. doi:10.1016/j.atherosclerosis.2024.118552
- Sniderman AD, Thanassoulis G, Glavinovic T, et al. Apolipoprotein B Particles and Cardiovascular Disease: A Narrative Review. JAMA Cardiol. 2019;4(12):1287-1295. doi:10.1001/jamacardio.2019.3780
- Rosenson RS, Hegele RA, Gotto AM Jr. Integrated Measure for Atherogenic Lipoproteins in the Modern Era: Risk Assessment Based on Apolipoprotein B. J Am Coll Cardiol. 2016;67(2):202-204. doi:10.1016/j.jacc.2015.10.059
- De Oliveira-Gomes D, Joshi PH, Peterson ED, Rohatgi A, Khera A, Navar AM. Apolipoprotein B: Bridging the Gap Between Evidence and Clinical Practice. Circulation. 2024;150(1):62-79. doi:10.1161/CIRCULATIONAHA.124.068885
- Zhang Y, Pletcher MJ, Vittinghoff E, et al. Association Between Cumulative Low-Density Lipoprotein Cholesterol Exposure During Young Adulthood and Middle Age and Risk of Cardiovascular Events. JAMA Cardiol. 2021;6(12):1406-1413. doi:10.1001/jamacardio.2021.3508
- Navar-Boggan AM, Peterson ED, D’Agostino RB Sr, Neely B, Sniderman AD, Pencina MJ. Hyperlipidemia in early adulthood increases long-term risk of coronary heart disease. Circulation. 2015;131(5):451-458. doi:10.1161/CIRCULATIONAHA.114.012477
- Wilkins JT, Ning H, Sniderman A, et al. Analysis of apoB Concentrations Across Early Adulthood and Predictors for Rates of Change Using CARDIA Study Data. J Lipid Res. 2022;63(12):100299. doi:10.1016/j.jlr.2022.100299
- Tang R, An J, Bellows BK, et al. Traditional and Emerging Lipid Markers for Cardiovascular Risk Assessment in Young vs Older Adults. JAMA Netw Open. 2026;9(4):e265199. doi:10.1001/jamanetworkopen.2026.5199
- Varvel SA, Dayspring TD, Edmonds Y, et al. Discordance between apolipoprotein B and low-density lipoprotein particle number is associated with insulin resistance in clinical practice. J Clin Lipidol. 2015;9(2):247-255. doi:10.1016/j.jacl.2014.11.005
- Johannesen CDL, Mortensen MB, Nordestgaard BG, Langsted A. Discordance analyses comparing LDL cholesterol, Non-HDL cholesterol, and apolipoprotein B for cardiovascular risk estimation. Atherosclerosis. 2025;403:119139. doi:10.1016/j.atherosclerosis.2025.119139
- Wilkins JT, Li RC, Sniderman A, Chan C, Lloyd-Jones DM. Discordance Between Apolipoprotein B and LDL-Cholesterol in Young Adults Predicts Coronary Artery Calcification: The CARDIA Study. J Am Coll Cardiol. 2016;67(2):193-201. doi:10.1016/j.jacc.2015.10.055
- Johannesen CDL, Langsted A, Nordestgaard BG, Mortensen MB. Excess Apolipoprotein B and Cardiovascular Risk in Women and Men. J Am Coll Cardiol. 2024;83(23):2262-2273. doi:10.1016/j.jacc.2024.03.423
- Sehayek D, Cole J, Björnson E, et al. ApoB, LDL-C, and non-HDL-C as markers of cardiovascular risk. J Clin Lipidol. 2025;19(4):844-859. doi:10.1016/j.jacl.2025.05.024
- Sayed A, Peterson ED, Virani SS, Sniderman AD, Navar AM. Individual Variation in the Distribution of Apolipoprotein B Levels Across the Spectrum of LDL-C or Non-HDL-C Levels. JAMA Cardiol. 2024;9(8):741-747. doi:10.1001/jamacardio.2024.1310
- Björklund P, Härdfeldt J, Äikäs L, et al. Increased transvascular retention of atherogenic lipoproteins in type 2 diabetes relates to their enhanced proteoglycan binding. JCI Insight. 2026;11(10):e177849. doi:10.1172/jci.insight.177849
- Mazidi M, Webb RJ, Lip GYH, Kengne AP, Banach M, Davies IG. Discordance between LDL-C and Apolipoprotein B Levels and Its Association with Renal Dysfunction: Insights from a Population-Based Study. J Clin Med. 2022;11(2):313. doi:10.3390/jcm11020313
- Giannakopoulou SP, Antonopoulou S, Barkas F, et al. Concordance-discordance between apolipoprotein B and lipid biomarkers in predicting 20-year atherosclerotic cardiovascular disease risk: The ATTICA study (2002-2022). Eur J Clin Invest. 2025;55(10):e70077. doi:10.1111/eci.70077
- McGill HC Jr, McMahan CA, Herderick EE, Malcom GT, Tracy RE, Strong JP. Origin of atherosclerosis in childhood and adolescence. Am J Clin Nutr. 2000;72(5 Suppl):1307S-1315S. doi:10.1093/ajcn/72.5.1307s
- McGill HC Jr, McMahan CA, Malcom GT, Oalmann MC, Strong JP. Effects of serum lipoproteins and smoking on atherosclerosis in young men and women. The PDAY Research Group. Pathobiological Determinants of Atherosclerosis in Youth. Arterioscler Thromb Vasc Biol. 1997;17(1):95-106. doi:10.1161/01.atv.17.1.95
- Berenson GS, Srinivasan SR, Bao W, Newman WP 3rd, Tracy RE, Wattigney WA. Association between multiple cardiovascular risk factors and atherosclerosis in children and young adults. The Bogalusa Heart Study. N Engl J Med. 1998;338(23):1650-1656. doi:10.1056/NEJM199806043382302
- Gidding SS, McMahan CA, McGill HC, et al. Prediction of coronary artery calcium in young adults using the Pathobiological Determinants of Atherosclerosis in Youth (PDAY) risk score: the CARDIA study. Arch Intern Med. 2006;166(21):2341-2347. doi:10.1001/archinte.166.21.2341
- Hartiala O, Magnussen CG, Kajander S, et al. Adolescence risk factors are predictive of coronary artery calcification at middle age: the cardiovascular risk in young Finns study. J Am Coll Cardiol. 2012;60(15):1364-1370. doi:10.1016/j.jacc.2012.05.045
- Steffen BT, Guan W, Remaley AT, et al. Apolipoprotein B is associated with carotid atherosclerosis progression independent of individual cholesterol measures in a 9-year prospective study of Multi-Ethnic Study of Atherosclerosis participants. J Clin Lipidol. 2017;11(5):1181-1191.e1. doi:10.1016/j.jacl.2017.07.001
- Wallenfeldt K, Bokemark L, Wikstrand J, Hulthe J, Fagerberg B. Apolipoprotein B/apolipoprotein A-I in relation to the metabolic syndrome and change in carotid artery intima-media thickness during 3 years in middle-aged men. Stroke. 2004;35(10):2248-2252. doi:10.1161/01.STR.0000140629.65145.3c
- Stone GW, Maehara A, Lansky AJ, et al. A prospective natural-history study of coronary atherosclerosis. N Engl J Med. 2011;364(3):226-235. doi:10.1056/NEJMoa1002358
- Erlinge D, Maehara A, Ben-Yehuda O, et al. Identification of vulnerable plaques and patients by intracoronary near-infrared spectroscopy and ultrasound (PROSPECT II): a prospective natural history study. Lancet. 2021;397(10278):985-995. doi:10.1016/S0140-6736(21)00249-X
- Williams MC, Kwiecinski J, Doris M, et al. Low-Attenuation Noncalcified Plaque on Coronary Computed Tomography Angiography Predicts Myocardial Infarction: Results From the Multicenter SCOT-HEART Trial (Scottish Computed Tomography of the HEART). Circulation. 2020;141(18):1452-1462. doi:10.1161/CIRCULATIONAHA.119.044720
- Tzolos E, Williams MC, McElhinney P, et al. Pericoronary Adipose Tissue Attenuation, Low-Attenuation Plaque Burden, and 5-Year Risk of Myocardial Infarction. JACC Cardiovasc Imaging. 2022;15(6):1078-1088. doi:10.1016/j.jcmg.2022.02.004
- Jia H, Abtahian F, Aguirre AD, et al. In vivo diagnosis of plaque erosion and calcified nodule in patients with acute coronary syndrome by intravascular optical coherence tomography. J Am Coll Cardiol. 2013;62(19):1748-1758. doi:10.1016/j.jacc.2013.05.071
- Nicholls SJ, Puri R, Anderson T, et al. Effect of Evolocumab on Progression of Coronary Disease in Statin-Treated Patients: The GLAGOV Randomized Clinical Trial. JAMA. 2016;316(22):2373-2384. doi:10.1001/jama.2016.16951
- Biccirè FG, Häner J, Losdat S, et al. Concomitant Coronary Atheroma Regression and Stabilization in Response to Lipid-Lowering Therapy. J Am Coll Cardiol. 2023;82(18):1737-1747. doi:10.1016/j.jacc.2023.08.019
- Nicholls SJ, Kataoka Y, Nissen SE, et al. Coronary Atheroma Regression With Evolocumab in Stable and Unstable Coronary Syndromes. JACC Cardiovasc Imaging. 2023;16(1):130-132. doi:10.1016/j.jcmg.2022.07.020
- Iatan I, Guan M, Humphries KH, Yeoh E, Mancini GBJ. Atherosclerotic Coronary Plaque Regression and Risk of Adverse Cardiovascular Events: A Systematic Review and Updated Meta-Regression Analysis. JAMA Cardiol. 2023;8(10):937-945. doi:10.1001/jamacardio.2023.2731
- Ference BA, Ginsberg HN, Graham I, et al. Low-density lipoproteins cause atherosclerotic cardiovascular disease. 1. Evidence from genetic, epidemiologic, and clinical studies. A consensus statement from the European Atherosclerosis Society Consensus Panel. Eur Heart J. 2017;38(32):2459-2472. doi:10.1093/eurheartj/ehx144
- Richardson TG, Wang Q, Sanderson E, et al. Effects of apolipoprotein B on lifespan and risks of major diseases including type 2 diabetes: a mendelian randomisation analysis using outcomes in first-degree relatives. Lancet Healthy Longev. 2021;2(6):e317-e326. doi:10.1016/S2666-7568(21)00086-6
- Wiggins BS, Barac A, Benziger CP, et al. 2026 Dyslipidemia Guideline-at-a-Glance. J Am Coll Cardiol. 2026;87(19):2617-2623. doi:10.1016/j.jacc.2026.02.4872
- Soffer DE, Marston NA, Maki KC, et al. Role of apolipoprotein B in the clinical management of cardiovascular risk in adults: An Expert Clinical Consensus from the National Lipid Association. J Clin Lipidol. 2024;18(5):e647-e663. doi:10.1016/j.jacl.2024.08.013
- Mach F, Baigent C, Catapano AL, et al. 2019 ESC/EAS Guidelines for the management of dyslipidaemias: lipid modification to reduce cardiovascular risk. Eur Heart J. 2020;41(1):111-188. doi:10.1093/eurheartj/ehz455
- Pearson GJ, Thanassoulis G, Anderson TJ, et al. 2021 Canadian Cardiovascular Society Guidelines for the Management of Dyslipidemia for the Prevention of Cardiovascular Disease in Adults. Can J Cardiol. 2021;37(8):1129-1150. doi:10.1016/j.cjca.2021.03.016
- Lee SE, Chang HJ, Rizvi A, et al. Rationale and design of the Progression of AtheRosclerotic PlAque DetermIned by Computed TomoGraphic Angiography IMaging (PARADIGM) registry: a comprehensive exploration of plaque progression and its impact on clinical outcomes from a multicenter serial coronary computed tomographic angiography study. Am Heart J. 2016;182:72-79. doi:10.1016/j.ahj.2016.09.003
- Soto-Mota A, Norwitz NG, Manubolu VS, et al. Plaque begets plaque, ApoB does not: longitudinal data from the KETO-CTA trial. JACC Adv. 2025;4(7):101686. doi:10.1016/j.jacadv.2025.101686. [Retracted]
- Expression of Concern: “Plaque Begets Plaque. ApoB Does Not: Longitudinal Data from The KETO-CTA Trial” [JACC: Advances, Volume 4, Issue 7, July 2025, Article 101686]. JACC Adv. 2026;5(3):102607. doi:10.1016/j.jacadv.2026.102607
- Kaplan H, Thompson RC, Trumble BC, et al. Coronary atherosclerosis in indigenous South American Tsimane: a cross-sectional cohort study. Lancet. 2017;389(10080):1730-1739. doi:10.1016/S0140-6736(17)30752-3
Disclosure and status. This is a narrative review and research framework. It defines cumulative apoB exposure as a descriptive measure and argues explicitly that it is not yet a validated individual risk metric; it recommends no cumulative-exposure threshold and provides no individual risk score. Reference [23] uses the online-published version of the cited JAMA Cardiology article; page numbers follow the print issue. Clinical decisions should follow current guideline recommendations.