
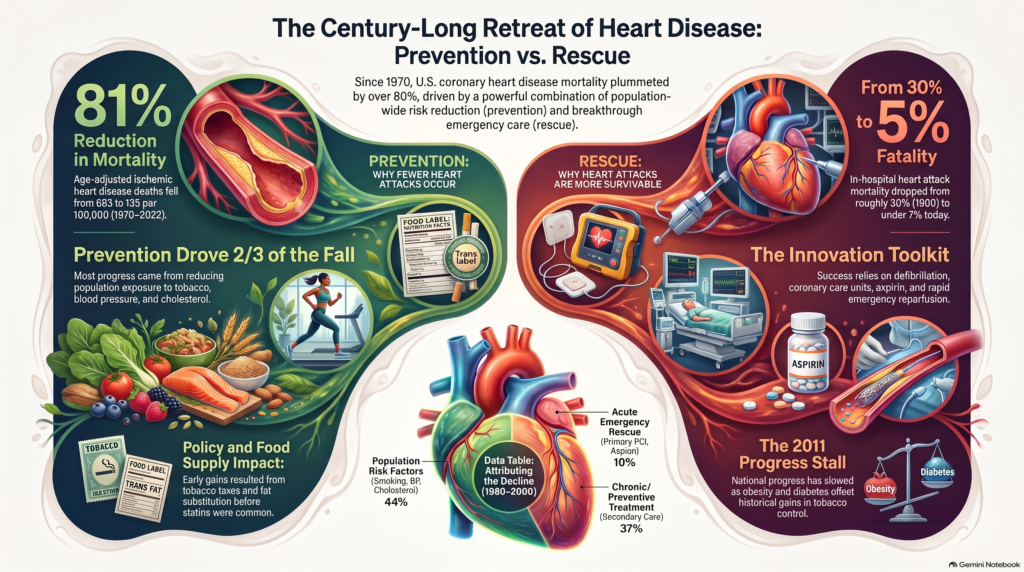
The Hundred-Year Retreat of Coronary Heart Disease
What Actually Happened, How Much Modern Cardiology Contributed, and What Should Happen Next
A narrative and systematic evidence review, c. 1925–2026
Peter Megdal, PhD August 24, 2026
Table of Contents
The Hundred-Year Retreat of Coronary Heart Disease. 3
What Actually Happened, How Much Modern Cardiology Contributed, and What Should Happen Next 3
Plain-language executive summary. 3
The answer in one paragraph.. 4
Central quantitative conclusions. 5
Part I. The story: how a disease rose and fell 7
An epidemic that had to be discovered before it could be counted (c. 1900–1949). 7
The peak, and the turn (1950–1969). 7
The steep descent (1970–1989). 8
The pharmacological consolidation (1990–2009). 9
Table 1 — The hundred-year timeline. 10
Figure 1 — U.S. age-adjusted coronary mortality trajectory. 11
Figure 2 — When the tools arrived. 12
Part II. Measuring the decline properly. 13
What the surveillance actually shows. 14
Part III. Why it happened: the attribution literature. 15
How the models work, and what they can and cannot tell you.. 15
The double-counting problem, and how it is handled. 16
Biological lag times: why attribution windows matter. 16
Table 2 — Major attribution studies. 17
Figure 3 — A concrete decomposition (U.S., 1980–2000). 20
Which risk factors mattered most?. 20
Table 3 — Contribution of individual risk factors. 20
Part IV. Prevention: what the randomized evidence actually proves. 23
LDL and apolipoprotein B lowering. 23
Antiplatelet therapy and the secondary-prevention bundle. 24
Table 4 — Major medical advances. 25
Part V. Rescue: how a heart attack stopped being a death sentence. 29
The equation that separates prevention from rescue. 29
Table 5 — Acute MI survival across eras. 30
The interventions, in causal perspective. 31
Japan: the decisive counterexample. 32
Part VI. Revascularization: three different operations wearing one name. 32
Table 6 — Prevention versus rescue. 33
Part VII. Counterfactuals and lives saved. 35
What if a modern population had old medical care — or old risk factors?. 35
How many lives were saved?. 36
Part VIII. International natural experiments. 36
Poland: an accidental national experiment in the food supply. 38
Russia and the post-Soviet surge: the experiment run in reverse. 38
Table 7 — Natural experiments in cardiovascular epidemiology. 39
Part IX. The stall, and who has been left behind. 40
Part X. What comes next: doing better than we are doing today. 41
- Treat cumulative lifetime exposure, not middle-aged thresholds. 41
- Finally treat lipoprotein(a). 42
- Extend the lipid-lowering toolkit and solve adherence. 42
- Treat the cardiometabolic driver directly. 42
- Address residual inflammatory risk. 43
- Find the people at risk before the event. 43
- Population policy retains exceptionally large leverage. 43
And above all: close the implementation gap. 44
Table 8 — The forward agenda. 44
Evidence hierarchy and the evidence ledger. 45
Structured summaries where abstract-level evidence was used. 50
Evidence gaps and remaining uncertainty. 51
Confidence grades for the main conclusions. 52
Plain-language executive summary
For most of medical history, nobody was diagnosed as dying of a heart attack — not because myocardial infarction did not occur, but because it had not yet been recognized as a clinical syndrome. Coronary thrombosis was described as a clinical syndrome in the living patient only in 1912.[1] Within four decades it had become the leading cause of death in the industrialized world. Within another four decades it was in headlong retreat. This is one of the most extraordinary reversals in the history of medicine, and it is routinely explained badly.
The popular version — that cardiology invented statins and stents and thereby conquered heart disease — is wrong on chronology alone. Coronary mortality in the United States peaked around 1968 and had already fallen by roughly a third before the first statin was approved, before ACE inhibitors, before primary angioplasty, and before anyone had run a randomized trial of aspirin in acute myocardial infarction. The opposite version — that the decline was purely a matter of people smoking less and eating better, with medicine along for the ride — is equally wrong. Modern therapeutics account for a very large minority, and in some countries and eras close to half, of the fall.
The accurate version is that two different things happened at once, and they should never be confused with one another:
First, fewer people had heart attacks. Populations reduced their lifetime exposure to three of the dominant modifiable drivers of atherosclerosis: tobacco smoke, elevated blood pressure, and atherogenic cholesterol. These are not the only causal contributors — diabetes, adiposity, and metabolic dysfunction matter too, and their trends have moved in the wrong direction. Some of that came from individual behavior, much of it came from policy and the food supply, and an increasing share over time came from drugs — antihypertensives from the 1970s, statins from the mid-1990s.
Second, the people who did have heart attacks stopped dying from them. In 1960, being admitted to hospital with an acute myocardial infarction carried roughly a one-in-three to one-in-five chance of not leaving. Contemporary in-hospital mortality after ST-elevation infarction in high-income systems is often around 4–7%, though the figure varies substantially with case mix and is not a universal all-AMI value. Coronary care units, defibrillation, cardiopulmonary resuscitation, emergency medical systems, aspirin, thrombolysis, and primary percutaneous coronary intervention did this. These acute-rescue interventions primarily improve survival after an event rather than prevent first myocardial infarctions.
Both achievements lower the coronary death rate, and the death rate alone cannot tell you which one is responsible. The best international data suggest that during the classic decline decades roughly two-thirds of the fall in coronary mortality came from having fewer coronary events and roughly one-third from surviving them.
Then there is the part of the story that is not yet written into the textbooks. The decline has stalled. In the United States and the United Kingdom, progress slowed sharply after about 2011, and among adults under 55 some acute outcomes have begun to move the wrong way. Obesity and type 2 diabetes have been subtracting from the ledger for thirty years; national blood-pressure control has deteriorated; and the easy wins from tobacco control have largely been banked. The next hundred years of progress will not come from repeating the last hundred. It is likely to depend increasingly on treating cumulative lifetime atherogenic exposure rather than middle-aged risk thresholds, on lipoprotein(a) if outcome trials confirm benefit, on the cardiometabolic revolution now underway with incretin therapies, on residual inflammatory risk, and above all on closing the vast implementation gap between what we know works and what patients actually receive.
The answer in one paragraph
Coronary heart disease rose through the first half of the twentieth century, peaked in most high-income countries in the 1960s, and then underwent one of the largest sustained mortality declines documented for a major cause of death. In the United States, age-adjusted ischemic heart disease mortality fell from 693 to 135 deaths per 100,000 between 1970 and 2022 — an 81% reduction — while mortality coded specifically to acute myocardial infarction fell from 354 to 40 per 100,000, an 89% reduction [2]. The best available attribution models do not support crediting that achievement to “medicine” alone or to “lifestyle” alone. Across the United States and several European countries during the principal decline eras, roughly 44–73% of the fall was attributed to favorable population risk-factor change, while approximately 23–47% was attributed to medical and surgical treatment; acute coronary treatment itself usually accounted for only about 4–12% of the overall mortality decline in IMPACT-type models [3,4,5,6,7,8]. In parallel, WHO MONICA data indicate that roughly two-thirds of the decline in coronary mortality in the 1980s–1990s came from fewer coronary events and one-third from better survival after an event, with substantial variation between populations [9].
The practical conclusion: much of the historical reduction in coronary-event incidence appears to have resulted from changes in the population’s underlying exposure to atherosclerotic risk — especially smoking, blood pressure, and cholesterol — while modern cardiology made a very large additional contribution by medically lowering those same risks, preventing recurrent events, and transforming a heart attack from an event with roughly 20–30% short-term mortality into one that is, in contemporary high-income healthcare systems, far more survivable.
Central quantitative conclusions
| Question | Best defensible synthesis | Confidence |
| How much has U.S. CHD/IHD mortality fallen? | Age-adjusted IHD mortality fell 81% from 1970–2022; acute-MI–coded mortality fell 89%. Over the best-documented single interval, age-adjusted CHD mortality fell roughly 50% between 1980 and 2000. Earlier historical series show heart-disease mortality rising into a mid-century peak before the sustained decline. | High |
| How much has MI incidence fallen? | No valid universal century-long figure exists. Framingham ECG-defined first MI fell about 50% from 1960–1999; Icelandic MI incidence fell 66% from 1981–2006; ARIC showed annual declines of roughly 3–4% in most sex/race groups during 1987–2008. Japan demonstrates that incidence need not fall at all: Miyagi rose from 7.4 to 27.0 per 100,000 between 1979 and 2008. | Moderate |
| How much has MI case fatality fallen? | Framingham age- and sex-adjusted 30-day, 1-year, and 5-year case fatality each fell about 60% from 1960–1999; Miyagi in-hospital mortality fell from 20.0% to 7.8% across 1979–2008. Pre-coronary-care-unit hospital mortality of roughly 30% compares with contemporary in-hospital STEMI mortality of roughly 4–7%. | High for direction; Moderate for cross-era magnitude |
| Population risk-factor contribution | Generally ~45–70%, with individual IMPACT estimates ranging from 44% (U.S.) to 73% (Iceland). | Moderate |
| All medical/surgical treatment contribution | Generally ~25–45%, ranging approximately 23–47% in major IMPACT analyses. | Moderate |
| Acute/emergency treatment contribution | Usually ~5–10% of the total CHD mortality decline in attribution models (approximately 4–12% across countries). But improvements in case fatality — to which improvements in acute systems of care contributed substantially — account for roughly one-third of the fall in coronary mortality in MONICA-type decomposition. | Moderate |
| Other/diagnostic/health-system contribution | Not independently identifiable. IMPACT residuals are commonly ~5–10%, but this residual must not be equated with EMS, diagnosis, or health-system improvement, because many such effects are already embedded within the treatment estimates. | Low |
| Has progress continued? | No. The decline slowed markedly after ~2011 in the U.S. and U.K. and has stagnated in younger adults, with recent evidence of worsening in-hospital mortality after a first STEMI in adults aged 18–54. Obesity, diabetes, and hypertension control remain important population-level counterweights. | Moderate–High |
A critical terminology point governs everything that follows: the “risk-factor” category is not a synonym for personal lifestyle choice. Falling smoking prevalence reflects taxation, smoke-free legislation, advertising restriction, physician counseling, and individual decision. Falling population cholesterol reflects food-supply reformulation, dietary change, and statins. Falling blood pressure reflects both secular population shifts and antihypertensive prescribing. The strongest analyses explicitly separate these pathways rather than double-count them. In the Swedish IMPACT work, for example, a 0.64 mmol/L population cholesterol decline was decomposed into approximately 5,210 deaths prevented or postponed through dietary change and 810 through statins, while a 2.6 mmHg fall in systolic pressure was divided into roughly 900 deaths from secular change and 575 from antihypertensive treatment [10].
Part I. The story: how a disease rose and fell
An epidemic that had to be discovered before it could be counted (c. 1900–1949)
The first difficulty in writing a hundred-year history of myocardial infarction is that for the first quarter of it, the diagnosis barely existed. James Herrick’s 1912 description of coronary thrombosis in the living patient — largely ignored for a decade — established that a blocked coronary artery was survivable and therefore diagnosable rather than simply a post-mortem finding.[1] The electrocardiograph made it identifiable at the bedside. Only then could anyone begin counting.
What we can say with confidence is that heart disease became the leading cause of death in the United States in 1921, and that coronary mortality continued to rise through the 1930s, 1940s, and 1950s. What we cannot say is how much of that apparent rise was a genuine increase in atherosclerotic events and how much was improved recognition, better death certification, and the simple fact that populations were surviving long enough — past infectious disease, past tuberculosis, past childbirth — to develop coronary disease at all. Almost certainly it was both, with mass cigarette adoption, adverse blood-pressure trends, and a changing food supply likely contributing substantially — though the causal partition for this early period is intrinsically uncertain.
Effective evidence-based coronary therapy was extremely limited. The standard treatment for acute infarction was six weeks of strict bed rest, on the theory that the damaged myocardium needed to be spared work. There was no monitoring, no way to treat the arrhythmia that killed a substantial share of patients in the first hours, no way to reopen the artery, and no validated modern risk-factor framework for coronary prevention — diet, exercise, tobacco, and blood pressure had all been discussed, but prospective risk-factor science did not yet exist. A patient who reached hospital alive had perhaps a two-in-three to four-in-five chance of leaving it.
The peak, and the turn (1950–1969)
Two things had to happen before the epidemic could be reversed, and both happened in this era.
The risk factors were discovered. The Framingham Heart Study, begun in 1948, gave the world the very concept of a “risk factor” and identified blood pressure, cholesterol, and smoking as the principal modifiable ones. Ancel Keys’s Seven Countries Study linked population dietary patterns to serum cholesterol to coronary incidence.[11] The 1964 U.S. Surgeon General’s report made tobacco’s causal role official policy rather than academic opinion. None of this treated a single patient. All of it made everything downstream possible.
Rescue was invented. The coronary care unit — Desmond Julian’s proposal, realized in units in Kansas City, Toronto, Philadelphia, and Sydney in the early 1960s — was one of the most consequential innovations in the acute treatment of myocardial infarction, and it involved no drug at all. Its insight was simple: a large fraction of early MI deaths were caused by ventricular fibrillation, ventricular fibrillation is instantly reversible if you are standing there with a defibrillator, and therefore patients should be watched continuously by people trained to shock them. Closed-chest cardiac massage was described in 1960; external defibrillation had been demonstrated in the preceding decade. Historical series suggest hospital mortality for acute MI fell from roughly 30% toward 15% with the arrival of coronary care.[12]
The evidence base for this is weaker than its importance would suggest — most of it is before-and-after observational work, and a famous strand of British research argued that home care was no worse for selected patients. A prospective randomized comparison of coronary care unit versus general ward admission found overall mortality of 15.3% (17/111) versus 29.3% (27/92), with the risk of dying on the general ward relative to the unit of 2.3 (95% CI 1.1–4.8), and sudden death more frequent on the general ward.[13] That trial is small, single-centre, and drawn from a care context unlike today’s, and the wider evidence base is largely observational;[14] but the temporal signal across many institutions is consistent and large.
Meanwhile, effective antihypertensive therapy arrived. The Veterans Administration Cooperative Studies (1967, 1970) demonstrated that treating severe and then moderate hypertension prevented strokes, heart failure, and death — landmark randomized evidence that pharmacologically modifying a cardiovascular risk factor changed clinical outcomes.[15]
U.S. coronary mortality peaked around 1968 and began to fall.
The steep descent (1970–1989)
This is the era that most decisively refutes the “modern cardiology did it” narrative, because for most of it modern cardiology did not yet exist. There were no statins until 1987 and no statin outcome trial until 1994. There was no ACE inhibitor trial in heart failure until 1987 or post-infarction until 1992. Balloon angioplasty was performed for the first time in 1977 and remained a niche procedure for a decade. Aspirin was not proven in acute MI until 1988.
The decline was noticed before it was explained. The 1978 Bethesda Conference, convened by the National Heart, Lung, and Blood Institute, was called specifically to document and account for an unexpected downturn in U.S. coronary and stroke mortality that nobody had predicted and nobody could yet attribute. That conference is the origin point of the entire attribution literature reviewed below.[16]
And yet U.S. age-adjusted ischemic heart disease mortality, 693 per 100,000 in 1970, fell steeply and continuously throughout the period. What changed instead was exposure. Male smoking prevalence fell substantially in the wake of the Surgeon General’s report and the subsequent advertising restrictions. Serum cholesterol fell as the food supply shifted. The National High Blood Pressure Education Program (1972) drove detection and treatment of hypertension into routine primary care. And in North Karelia, Finland — then recording among the highest coronary mortality rates documented anywhere, particularly among working-age men — an explicitly community-based prevention program began in 1972 and demonstrated that a population’s risk-factor profile could be deliberately changed.
Toward the end of the era the therapeutic revolution finally arrived, and it arrived in the emergency department. GISSI (1986)[17] and then ISIS-2 (1988)[18] established that streptokinase and aspirin each independently reduced death in acute myocardial infarction and that together they reduced it dramatically. The randomized trials of coronary artery bypass grafting conducted between 1972 and 1984 established that survival benefit was concentrated in left main and extensive multivessel disease, with little demonstrable survival benefit in less extensive disease — though benefit also varied with left ventricular function and anatomy.[19]
The pharmacological consolidation (1990–2009)
If the 1970s and 1980s belonged to population prevention and acute rescue, this era belonged to chronic pharmacotherapy and to systems of care.
The 4S trial (1994) showed that simvastatin reduced mortality in patients with coronary disease, and within a decade statins had become among the most prescribed drugs on earth.[20] ACE inhibitors moved from heart failure into post-infarction care. Beta-blockers, aspirin, and lipid lowering consolidated into a standard secondary-prevention bundle. Coronary stents reduced acute recoil and abrupt closure and substantially reduced restenosis compared with balloon angioplasty — though restenosis was reduced, not eliminated, and drug-eluting stents later reduced it further. Dual antiplatelet therapy substantially reduced thrombotic complications and helped make routine stenting practical. Primary PCI progressively displaced thrombolysis for ST-elevation infarction[21], and organized STEMI networks — prehospital ECG, catheterization laboratory activation from the ambulance, measured door-to-balloon times — made timely reperfusion increasingly a systems-and-logistics challenge that health systems could optimize.
Both incidence and case fatality fell measurably during this period, and this is the era in which quantitative attribution is strongest, because treatment uptake was documented, trial efficacy was known, and risk-factor surveillance was systematic. It is also the era in which the counterweights became visible: obesity and type 2 diabetes began subtracting from the ledger, and many major attribution models from this period recorded them as negative contributions.
The stall (2010–2026)
Mortality remains far below its historical peak — U.S. ischemic heart disease mortality reached 135 per 100,000 in 2022 — but the trajectory has changed character. In the United States and the United Kingdom, the rate of decline slowed markedly after roughly 2011. In adults under 55, and particularly women, the long-term decline has slowed or stagnated, with some studies reporting adverse trends in specific coronary outcomes.[22] The absolute burden remains enormous: the United States recorded 915,973 cardiovascular deaths in 2023, an age-adjusted CVD death rate of 218.3 per 100,000[23], and globally GBD 2023 estimated 19.2 million cardiovascular deaths[24], because population growth and aging can drive absolute deaths up even while individual age-adjusted risk falls.
The candidate explanations for the stall are unflattering and largely non-technological: obesity and diabetes at levels no previous generation faced; the exhaustion of easy tobacco gains in populations where smoking is already uncommon; and, in the United States, a documented deterioration in hypertension control from 53.8% (2013–2014) to 43.7% (2017–2018)[25]. The COVID-19 pandemic then produced an abrupt reversal — the U.S. age-adjusted CVD death rate was 330.8 in 2019, 346.0 in 2020, and 359.6 in 2021 per 100,000 among adults aged 25 and over — erasing several years of progress in two. This series covers adults aged 25 and over and is not directly comparable with the all-adult, differently standardized rate of 218.3 per 100,000 cited above; the two must not be read as a single trend.
Table 1 — The hundred-year timeline
| Era | CHD/MI epidemiology | Population and risk-factor developments | Medical and emergency developments | Evidential interpretation |
| 1925–1949 | CHD rising; comparable population MI-incidence surveillance largely unavailable. Heart disease became the leading U.S. cause of death by 1921. | Cigarette consumption and other adverse coronary exposures rose steeply; risk-factor theory did not yet exist. | ECG increasingly used clinically; treatment of MI was bed rest and supportive care. | Tier 3/5. Mortality data are broadly reliable; causal attribution is far weaker than after 1950. |
| 1950–1969 | CHD mortality remained high and rose to its U.S. peak around 1968. | Framingham and Seven Countries identified smoking, blood pressure, and cholesterol as modifiable risks; 1964 Surgeon General’s report. | External defibrillation, CPR, coronary care units, effective hypertension therapy, first CABG. CCUs associated with hospital MI mortality falling from ~30% toward ~15%. | Tier 2–5. The early survival change is compelling but largely observational. |
| 1970–1989 | Sustained steep decline begins; U.S. age-adjusted IHD mortality was 693/100,000 in 1970. | Smoking falls substantially; population BP and cholesterol improve; North Karelia launches intensive community prevention. | Widespread antihypertensive treatment, CABG, PTCA (1977), beta-blockers, aspirin, cardiac rehabilitation, thrombolysis; first statins late in the era. ISIS-2 establishes aspirin and streptokinase. | Tier 1–4. Population prevention and evidence-based cardiology begin contributing simultaneously. |
| 1990–2009 | Large falls in both MI incidence and case fatality become measurable in ARIC and Framingham. | Further smoking, cholesterol, and BP improvement, increasingly offset by obesity and diabetes. | Statins, ACE inhibitors, stents, dual antiplatelet therapy, modern EMS, primary PCI mainstream. Primary PCI outperforms thrombolysis in randomized synthesis. | Tier 1–4. The strongest era for quantitative attribution. |
| 2010–2026 | Mortality far below peak but decline stalls; stagnation in younger adults, with recent worsening in hospitalized first-STEMI mortality at ages 18–54. U.S. IHD mortality 135/100,000 in 2022. | Tobacco continues downward in high-income settings; obesity, diabetes, and metabolic risk counteract gains; U.S. hypertension control deteriorates. | Intensive statins, ezetimibe, PCSK9 inhibition, optimized ACS systems, radial PCI, high-sensitivity troponin, GLP-1 receptor agonists, colchicine. | Tier 1–3. Strong evidence for individual treatment efficacy; much weaker evidence partitioning recent national trends. |
Figure 1 — U.S. age-adjusted coronary mortality trajectory
Observed national mortality data. Historical and modern series are deliberately not numerically spliced, because age standards and disease coding changed.
Panel A — Key observed data points
| Series | Year | Age-adjusted rate per 100,000 | Change |
| Diseases of the heart (1940 standard) | 1950 | 307.4 | — |
| Diseases of the heart (1940 standard) | 1996 | 134.6 | −56% |
| Ischemic heart disease (modern series) | 1970 | 693 | — |
| Ischemic heart disease (modern series) | 2022 | 135 | −81% |
| Acute myocardial infarction | 1970 | 354 | — |
| Acute myocardial infarction | 2022 | 40 | −89% |
| All CVD, adults 25+ | 2019 | 330.8 | — |
| All CVD, adults 25+ | 2020 | 346.0 | +4.6% |
| All CVD, adults 25+ | 2021 | 359.6 | +8.7% vs 2019 |
Panel B — Shape of the trajectory
Heart disease becomes leading US cause of death ………. 1921
Mortality rises through ……………………………. 1930s-1960s
PEAK (coronary heart disease) ………………………. ~1968
Steep sustained decline ……………………………. 1968-2010
Decline slows/stagnates in younger adults;
selected acute outcomes worsen …………………….. ~2011 onward
Pandemic interruption ……………………………… 2020-2021
Ischemic heart disease, age-adjusted, per 100,000:
1970 693 ####################################
2022 135 #######
Acute myocardial infarction, age-adjusted, per 100,000:
1970 354 ##################
2022 40 ##
Sources: historical U.S. national mortality analyses (CDC/NCHS)[26]; King et al. 2025[2] for the 1970–2022 IHD and AMI series.
Figure 2 — When the tools arrived
Approximate clinical adoption timeline. Dates indicate emergence or the arrival of major evidence, not a single universal start date.
| Period | Prevention and chronic therapy | Acute rescue and systems |
| 1950s | Effective antihypertensive drugs emerging | External defibrillation |
| Early 1960s | Risk-factor concept established (Framingham) | CPR; coronary care units and continuous rhythm monitoring |
| Late 1960s | 1964 Surgeon General’s report on smoking | CABG enters clinical practice |
| 1970s | Beta-blockers; National High Blood Pressure Education Program; North Karelia | Balloon coronary angioplasty (1977); organized EMS expands |
| 1980s | Statins introduced (1987); cardiac rehabilitation formalized | Aspirin and thrombolysis established in acute MI (GISSI 1986, ISIS-2 1988) |
| 1990s | Statin outcome trials (4S 1994); ACE-inhibitor-based secondary prevention | Coronary stents; primary PCI increasingly replaces thrombolysis |
| 2000s | Intensive statin therapy; polypill concept | Public-access AED programs; modern STEMI networks; prehospital ECG |
| 2010s | Ezetimibe outcomes (2015); PCSK9 inhibitors (2017–18); SGLT2 inhibitors | High-sensitivity troponin widespread; radial access standard |
| 2020s | Very-low-LDL secondary prevention; colchicine; GLP-1 receptor agonists (SELECT 2023); inclisiran; bempedoic acid | Mature integrated ACS/EMS systems; Lp(a)-lowering agents in outcome trials |
Part II. Measuring the decline properly
Almost every popular error about this subject comes from conflating four different quantities. They are related, but they move independently and for different reasons.
Coronary event incidence is how often people have heart attacks. Case fatality is the proportion who die once they have one. CHD mortality is approximately the product of the two, plus recurrent events and sudden death outside hospital. Total cardiovascular mortality additionally includes stroke, heart failure, and other vascular death and is therefore a broader and less specific measure. A therapy that halves case fatality and a policy that halves incidence can produce identical falls in CHD mortality while representing entirely different achievements.
Four methodological cautions apply throughout.
Age standardization is mandatory. Crude death rates in an aging population can rise while individual risk falls steeply. Every trend statement in this review is age-adjusted or age-specific unless explicitly stated otherwise. It is also why absolute global cardiovascular deaths continue to increase while age-standardized rates fall.
Diagnostic criteria changed repeatedly, and this is not a minor artifact. Myocardial infarction has passed through successive biomarker eras: AST, LDH and total CK in the 1970s; CK-MB mass and activity assays in the 1980s and 1990s; conventional cardiac troponin I and T in the early 2000s; and high-sensitivity troponin assays from the 2010s — layered on top of the successive Universal Definitions of MI (2000, 2007, 2012, 2018).[27] As the analytical limit of detection fell from micrograms to sub-nanograms per litre, troponin elevations became detectable in patients who previously met no biomarker criterion. These categories must be kept distinct. Myocardial injury — any troponin elevation above the 99th percentile — is not itself myocardial infarction; it becomes infarction only when accompanied by clinical evidence of acute myocardial ischemia. Type 1 MI reflects atherothrombosis; type 2 MI requires an acute rise and/or fall in troponin plus clinical evidence of ischemia arising from supply–demand mismatch; and non-ischemic myocardial injury (sepsis, myocarditis, renal disease, heart failure) remains injury and is not MI at all. What the assay transition did was enlarge the population in whom troponin is measurable and abnormal, increasing recorded NSTEMI diagnoses while also increasing recognition of injury that is not infarction. This is sometimes called troponin-induced diagnostic reclassification, and it has two opposing effects: it artifactually raises recorded NSTEMI incidence in administrative databases, and it lowers apparent aggregate case fatality by enlarging the denominator with lower-risk patients. When standardized historical algorithms are applied longitudinally — strict Q-wave ECG criteria and constant biomarker thresholds, as in MONICA — the decline in standardized ECG-defined infarction appears steeper than raw administrative coding suggests. Framingham demonstrated the magnitude directly: between 1960 and 1999, ECG-defined MI incidence fell roughly 50% while infarctions detected predominantly through increasingly sensitive biomarkers approximately doubled.[28] Surveillance that standardizes on ECG criteria or explicitly adjusts for biomarker era — Framingham, ARIC, MONICA — therefore deserves far more weight than unadjusted hospital discharge coding.
Competing risks matter. As cancer, stroke, and other causes of death shift, the population at risk of a coronary death changes. Falling coronary mortality partly redistributes deaths to other causes and to later ages rather than eliminating them; “deaths prevented or postponed” is the scientifically honest phrase.
A century-long MI incidence series does not exist and should not be manufactured. The honest statement is that reliable national incidence surveillance begins in the 1960s–1980s depending on the country, and that everything before that is mortality data plus inference.
What the surveillance actually shows
United States, mortality. Age-adjusted ischemic heart disease mortality fell from 693 to 135 per 100,000 between 1970 and 2022 (−81%), and AMI-coded mortality from 354 to 40 (−89%) [2]. Within that span, the best-documented single interval is 1980–2000, over which age-adjusted CHD death rates fell from 542.9 to 266.8 per 100,000 in men and from 263.3 to 134.4 in women [3]. Using the older 1940 age standard, “diseases of the heart” mortality fell from 307.4 per 100,000 in 1950 to 134.6 in 1996; these values must not be numerically spliced onto modern 2000-standard series.[26]
United States, incidence and case fatality. Framingham, following 9,824 participants over 212,539 person-years, found ECG-defined first-MI incidence fell approximately 50% from 1960–1999, while crude 30-day case fatality moved from 20% to 14%, one-year from 24% to 21%, and five-year from 45% to 41%; after age and sex adjustment, case fatality at all three horizons fell by about 60% [28]. ARIC, surveilling four U.S. communities from 1987–2008 with explicit biomarker adjustment for the enzyme-to-troponin transition, found incident hospitalized MI declining annually by about 4.3% in White men, 3.8% in White women, 3.4% in Black women — but only 1.5% in Black men, with 28-day case fatality declining approximately 2.6–3.6% per year by group [29]. ARIC also documented that infarctions themselves became smaller and less severe over time.[30]
Contemporary burden. Despite the decline, the United States recorded 915,973 cardiovascular deaths in 2023, with an age-adjusted CVD death rate of 218.3 per 100,000 versus 224.3 in 2022.[23] Globally, GBD estimated approximately 9.0 million ischemic heart disease deaths in 2021 with an age-standardized IHD mortality rate of about 108.7 per 100,000, representing a roughly 32% decline in age-standardized rate since 1990 — and 19.2 million total cardiovascular deaths in 2023.[24] Age-standardized risk is falling; absolute burden is not.
Part III. Why it happened: the attribution literature
How the models work, and what they can and cannot tell you
The strongest direct answer to “how much was medicine and how much was prevention” comes from IMPACT-type models, developed by Capewell and colleagues from 1996 and applied in more than twenty countries[3,4]. The method takes observed changes in population risk factors, observed treatment uptake, trial-derived efficacy estimates, patient numbers, and case fatality, and asks how many “deaths prevented or postponed” relative to a baseline year can be assigned to each component. The models have been shown to account for most of the observed mortality change in England, Scotland, Ireland, New Zealand, Finland, Sweden, and the United States, in the sense that the sum of modeled components typically reproduces 85–100% of the observed change. This is calibration and internal accounting, not independent validation of the causal attribution itself: a model can reproduce an aggregate total while misallocating it among components.
These are Tier 4 attribution models incorporating externally estimated causal effect sizes, not randomized experiments, and the percentages they produce are model-dependent. Their value is that the same broad finding recurs in populations with very different histories: risk-factor change usually explains somewhat more of the mortality decline than treatment does, but both are large.
The double-counting problem, and how it is handled
This is the single most important methodological issue in the field, and it is where most casual analyses fail. A fall in population mean blood pressure is partly caused by antihypertensive drugs[10], partly by diet and sodium intake, partly by body weight, and partly by other secular influences. A fall in population cholesterol is partly statins, partly dietary change, partly trans-fat removal from the food supply. If you credit “medicine” with the drug effect and separately credit “lifestyle” with the entire observed risk-factor change, you have counted the same biological improvement twice.
Well-implemented IMPACT models handle this in three ways. First, in well-specified implementations such as the Swedish analysis, individuals receiving a relevant treatment are removed from the population risk-factor calculation, so a statin-treated patient’s cholesterol fall is credited to statins, not to “diet.” This handling is implementation-specific and is not applied identically across all IMPACT models. Second, benefits from concurrent therapies are combined multiplicatively rather than added, using the Mant–Hicks approach, so that a patient on aspirin plus a beta-blocker plus a statin is not credited with the arithmetic sum of three relative risk reductions. Third, overlapping treatment populations are explicitly enumerated and adjusted.
The Swedish analysis is the most transparent worked example. Between 1986 and 2002, total cholesterol fell 0.64 mmol/L in the Swedish population. The model attributed approximately 5,210 deaths prevented or postponed to dietary change and 810 to statins. Smoking reduction accounted for about 1,195 deaths. A 2.6 mmHg fall in systolic pressure was divided into roughly 900 deaths from secular change and 575 from antihypertensive treatment. About three-quarters of the mortality reduction attributed to the three major risk factors occurred among people without diagnosed coronary disease — that is, in primary prevention.[10]
Models also apply compliance discounts to reflect real-world persistence rather than trial adherence — conventionally assuming 100% compliance during acute hospitalization, approximately 70% in symptomatic outpatients, and approximately 50% in asymptomatic primary-prevention populations. This matters: applying trial efficacy to prescription data without discounting systematically overstates the treatment share.
Residual double-counting remains possible even in good implementations, and this is a stated limitation rather than a solved problem.
Biological lag times: why attribution windows matter
A further complication rarely handled explicitly is that different interventions act on different timescales, so the same calendar window can flatter or penalize a given intervention depending on when it was adopted.
Weeks to months. Smoking cessation and antiplatelet therapy reduce coronary risk rapidly — before major anatomical plaque change would be expected.
One to two years. Pharmacological lipid lowering produces separating event curves in randomized trials within roughly 12–18 months[31], which is earlier than large changes in luminal geometry would be expected — the mechanism is generally attributed to plaque stabilization rather than anatomical regression, though the trial evidence establishes the outcome effect rather than the mechanism.
Decades. Cumulative ApoB exposure[32] and long-term blood-pressure burden operate over decades to influence atherosclerotic development and vascular injury. This is the timescale on which the population-level cholesterol decline of the 1970s and 1980s was operating — and it is why a model comparing 1980 with 2000 may capture the mortality consequence of dietary change that began two decades earlier, while assigning it to the wrong window.
Table 2 — Major attribution studies
| Study / population | Period | Observed CHD mortality decline | Risk-factor contribution | Treatment contribution | Other / unexplained | Access, tier, identifier |
| Ford et al., United States | 1980–2000 | Men 542.9→266.8/100k; women 263.3→134.4; 341,745 fewer deaths in 2000 | 44% | 47% | ~9% | Full text reviewed; Tier 4. NEJM 2007; DOI 10.1056/NEJMsa053935; PMID 17554120[3] |
| Unal et al., England & Wales | 1981–2000 | −62% men, −45% women; 68,230 fewer deaths | 58% | 42% | Model approximately complete after adverse trends | Abstract reviewed; Tier 4. Circulation 2004; PMID 14993137[4] |
| Laatikainen et al., Finland | 1982–1997 | −63% | 53–72% | 23% | Remainder/model uncertainty | Abstract reviewed; Tier 4. Am J Epidemiol 2005; DOI 10.1093/aje/kwi274; PMID 16150890[5] |
| Björck et al., Sweden | 1986–2002 | −53.4% men, −52.0% women; 13,180 fewer deaths | 55% | 36% | ~9% | Abstract + open follow-up full text; Tier 4. DOI 10.1093/eurheartj/ehn554; PMID 19141562[6] |
| Aspelund et al., Iceland | 1981–2006 | −80%; MI incidence −66% | 73% (sensitivity 54–93%) | 25% (8–40%) | ~2% | Abstract/results reviewed, open full text; Tier 4. DOI 10.1371/journal.pone.0013957; PMID 21103050[7] |
| Ireland IMPACT | 1985–2000 | −47% | 48.1% | 43.6% | ~8.3% | Abstract reviewed; Tier 4. PMID 16537349[8] |
| Bandosz et al., Poland | 1991–2005 | −54%; 26,200 fewer deaths in 2005 | 54% (cholesterol/dietary fat 39%, physical activity 10%, smoking in men 15%) | 37% | Remainder | Abstract reviewed; Tier 4. BMJ 2012 |
| Koopman et al., Netherlands | 1997–2007 | −48% (269→141/100,000); ~11,200 fewer deaths | ~36% (SBP 30%, cholesterol 10%, smoking 5%) | ~37% | ~27% (model explained ~72%) | Abstract reviewed; Tier 4. PLoS One 2016 |
| North Karelia (within-community) | 1972–1986 | Substantial early IHD incidence decline | Observed changes in the three major risk factors predicted the great majority of the early incidence decline, far exceeding the reference area (exact percentage attribution requires primary-source verification) | Not separately assigned | — | Tier 2/4 natural experiment. Int J Epidemiol 1989; DOI 10.1093/ije/18.3.595[35] |
These percentages must not be averaged into a universal constant. They differ because baseline smoking, cholesterol, and hypertension prevalence differed; because treatment uptake differed; because countries were studied during different phases of technological diffusion; because age ranges differed; and because the models include somewhat different components. England and Wales looks smoking-dominated because the British smoking epidemic was unusually severe and its reversal unusually rapid. The United States shows the largest treatment share partly because it was studied during precisely the decades in which American treatment uptake expanded fastest.
A defensible synthesis
For high-income countries during the principal 1970s–2000s decline:
- Population risk-factor change: approximately 45–70%
- Preventive and chronic treatment (including secondary prevention, heart failure care, hypertension and lipid treatment, revascularization for chronic angina): roughly 15–40%
- Direct acute MI/ACS treatment: roughly 5–10%, occasionally up to ~12%
- Explicit model residual: a few percent to ~10%
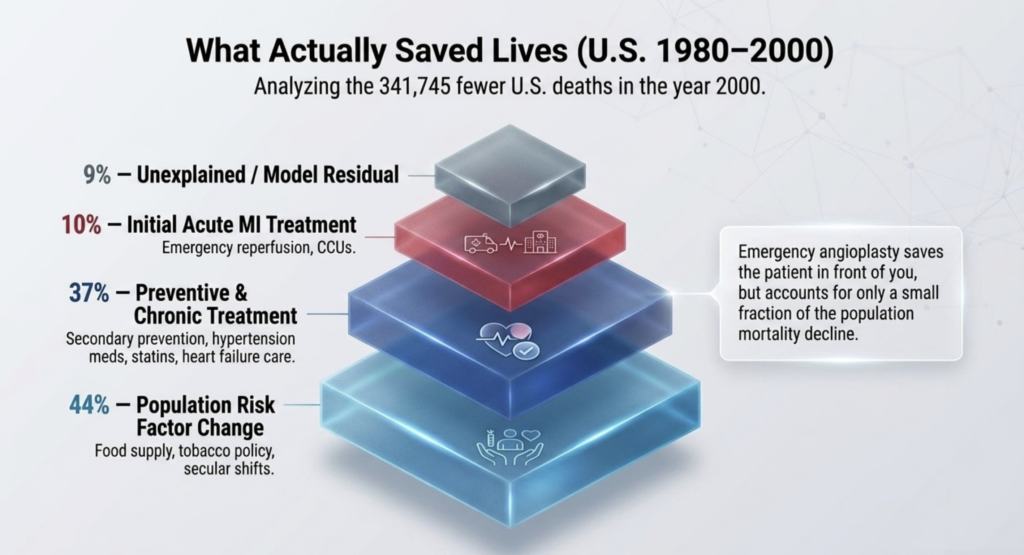
The A-versus-total-treatment comparison is far more robust than the B/C subdivision, which is not standardized across studies. For the United States specifically, the published 47% total treatment share included 10% for the initial treatment of AMI and unstable angina, permitting a U.S.-specific — not universal — reclassification of approximately 44% A, 37% B, 10% C, 9% D. The 37% figure is an author reclassification derived by subtraction from Ford et al., not a published category from that paper.
Figure 3 — A concrete decomposition (U.S., 1980–2000)
Model estimate, not a randomized decomposition, and not a universal hundred-year pie chart.
A Population risk-factor change 44% ######################
B Preventive / chronic treatment* 37% ###################
C Initial acute MI / unstable angina 10% #####
D Unexplained / model residual 9% ####
* AUTHOR RECLASSIFICATION, not a published category.
B = published 47% total treatment minus the published 10%
acute-MI / unstable-angina component. It therefore includes
secondary prevention, heart-failure care, hypertension
treatment, and chronic-angina revascularization — not only
drugs that prevent a first MI.
Within the acute category, Ford and colleagues separately calculated that initial AMI treatments alone accounted for about 21,570 deaths prevented or postponed, or 6.3% of the total decline, with sensitivity bounds of 2.6–11.0%.[3] This is the single most useful corrective to the intuition that emergency angioplasty explains the population-level fall in coronary mortality. At the population level, it plainly does not — however dramatic its effect on the individual patient in front of you.
Which risk factors mattered most?
The same three exposures recur — cholesterol, smoking, blood pressure — but their ranking varies dramatically with local history. In the U.S. 1980–2000 model, lower total cholesterol accounted for 24% of the decline, lower systolic blood pressure 20%, lower smoking prevalence 12%, and reduced physical inactivity 5%; rising BMI and diabetes offset gains equivalent to 8% and 10% respectively. In Iceland, cholesterol, smoking, and blood pressure contributed 32%, 22%, and 22%. In England and Wales, smoking alone accounted for 48%.[4]
Table 3 — Contribution of individual risk factors
| Risk factor | Approximate population mean shift (see note) | Approximate share of observed CHD mortality decline across major IMPACT analyses | Interpretation | Confidence |
| Population total-cholesterol reduction (reflecting, in part, lower atherogenic-lipoprotein exposure) | Substantial secular decline across U.S. and other high-income series | About 10–45%: U.S. 24%, Iceland 32%, Ireland 30.2%, Poland 39%; dominant in Sweden | One of the largest cumulative contributors, though the ranking varies by country. The share due to food environment versus medication changes markedly by era — predominantly non-statin and likely substantially related to dietary and food-supply change before the mid-1990s, increasingly pharmacological thereafter. | Moderate–High |
| Smoking reduction | U.S. adult prevalence fell from roughly 42% in 1965 to roughly 12% in recent years | Roughly 9–48%: U.S. 12%, Iceland 22%, Ireland 25.6%, England/Wales 48% | Enormous heterogeneity reflecting different starting epidemics and pace of tobacco control. Causally the most secure of all the risk factors. | High for causality; Moderate for exact attribution |
| Blood-pressure reduction | Mean systolic pressure declined materially in many high-income populations | Approximately 6–22%: U.S. 20%, Iceland 22%, England/Wales 9.5%, Ireland 6% | Includes secular population decline unless drug effects have been separately partitioned, as in Sweden. | High for causality; Moderate for historical share |
| Physical activity / inactivity | Modest reported decline in inactivity prevalence | Typically 1–10% where modeled; U.S. 5%, Poland 10% | Self-report and secular surveillance are substantially weaker than for smoking, BP, or cholesterol. | Low–Moderate |
| Diet independent of cholesterol and BP | Not separately quantified | Not safely additive to the cholesterol and BP contributions | The Swedish decomposition assigned most of the cholesterol-mediated benefit to diet. Counting “diet” plus the cholesterol decline it caused double-counts one biological pathway. | Moderate |
| Obesity | Mean BMI rose substantially; U.S. adult obesity exceeded 42% by 2020 | Negative: −1.5% to −8% across models; U.S. rising BMI added burden equivalent to 8% of the decline that would otherwise have occurred | Obesity blunted the decline; it did not produce it. | Moderate |
| Diabetes | U.S. diagnosed prevalence rose several-fold, exceeding 11% | Negative: −2% to −10% across models; U.S. offset equivalent to 10% | Rising diabetes prevented coronary mortality from falling considerably further. | Moderate–High |
Note on the second column: these are order-of-magnitude summaries of secular change drawn from differing national series, age ranges, and periods (predominantly US and other high-income data). They are intended to convey direction and approximate scale, not to serve as pooled measurements from a single sourced dataset, and they should not be quoted as precise population values.
One observation deserves emphasis because it is decisive for the whole argument: substantial population cholesterol lowering predated widespread statin use — statins reached the market only in 1987 and were not widely used in primary prevention until the late 1990s. An important contributor appears to have been changing dietary fat composition and the food supply — the substitution of polyunsaturated and monounsaturated fats for saturated animal fats, and later the regulatory elimination of industrial trans fats, beginning with Denmark in 2003 and followed by EU regulation and the U.S. FDA’s revocation of GRAS status[36]. In IMPACT models, population cholesterol reductions accounted for roughly 24–39% of the total decline across several countries; where explicitly decomposed, much of the pre-statin contribution was attributed to non-pharmacological change, while statins contributed only a few percent of the population cholesterol change up to 2000.
Similarly, a substantial share of the population-wide fall in blood pressure occurred in people not taking antihypertensive drugs. The mechanisms behind that non-pharmacological component are not securely partitioned in the literature and should not be attributed confidently to any single dietary or environmental cause.
The distinction the brief insists upon is worth restating: these are population exposures, not moral categories. Tobacco taxation, smoke-free legislation, industrial trans-fat elimination, sodium reformulation in processed food, and broader changes in food availability and composition are not “lifestyle choices.” They are policy and supply-chain interventions that changed the distribution of risk in entire populations, and they belong in the risk-factor column alongside individual behavior change.
Part IV. Prevention: what the randomized evidence actually proves
Historical attribution asks what did happen in a population. Randomized trials answer the complementary question of what a treatment can cause in the patients who receive it. These are different questions and must never be conflated. A drug can be enormously effective for the individual patient and still explain almost none of a historical mortality decline, simply because it was not yet available when the decline occurred.
Blood-pressure lowering
The Blood Pressure Lowering Treatment Trialists’ Collaboration pooled individual participant data from 344,716 participants in 48 randomized trials. For every 5 mmHg reduction in systolic pressure, major cardiovascular events fell by about 10%: hazard ratio 0.91 (95% CI 0.89–0.94) in participants without prior cardiovascular disease and 0.89 (0.86–0.92) in those with previous disease. Benefit was present across baseline blood-pressure strata, including in people whose pressure was not conventionally “hypertensive” [37] (Tier 1). Component estimates from this and related BPLTTC work indicate reductions of roughly 13% for stroke, 7% for ischemic heart disease, 14% for heart failure, and 5% for cardiovascular death per 5 mmHg.
This gives causal interpretation to the historical association. Some of the mortality gain assigned to “blood-pressure change” in attribution models genuinely was medicine; some was secular population shift. Sweden is valuable precisely because it attempted to separate the two.
LDL and apolipoprotein B lowering
The Scandinavian Simvastatin Survival Study (4S, 1994) opened the era, reducing all-cause mortality by 30% and coronary mortality by 42% in patients with established coronary disease[20] — a landmark demonstration that statin-mediated cholesterol lowering prolonged life rather than merely altering a laboratory value.
The Cholesterol Treatment Trialists’ Collaboration then made the relationship quantitative. Across 26 trials and approximately 170,000 participants, each 1.0 mmol/L (38.7 mg/dL) reduction in LDL-C produced a 22% reduction in major vascular events (RR 0.78, 95% CI 0.76–0.80), a 20% reduction in coronary mortality (RR 0.80, 99% CI 0.74–0.87), and a 10% reduction in all-cause mortality (RR 0.90, 95% CI 0.87–0.93) — the last driven entirely by vascular deaths, with no excess of cancer or non-vascular mortality.[31] In the individual-participant meta-analysis of 27 randomized trials focused on lower-risk participants, the rate ratio for major vascular events was 0.79 (95% CI 0.77–0.81) per 1.0 mmol/L; among participants without previous vascular disease, vascular mortality fell with RR 0.85 (0.77–0.95) and all-cause mortality with RR 0.91 (0.85–0.97) per 1 mmol/L [38] (Tier 1). Proportional benefit is remarkably consistent across baseline risk, age, and sex, and no lower threshold for benefit has been demonstrated within the ranges tested in randomized trials.
Non-statin trials confirm that the benefit tracks the magnitude of LDL lowering rather than representing an idiosyncratic statin property. In IMPROVE-IT, adding ezetimibe after acute coronary syndrome lowered the seven-year composite event rate from 34.7% to 32.7%, HR 0.936 (95% CI 0.89–0.99) [39]. In FOURIER, evolocumab lowered the primary composite from 11.3% to 9.8%, HR 0.85 (0.79–0.92), and cardiovascular death/MI/stroke from 7.4% to 5.9%, HR 0.80 (0.73–0.88) [40]. In ODYSSEY OUTCOMES, alirocumab after ACS reduced major adverse cardiovascular events from 11.1% to 9.5%, HR 0.85 (0.78–0.93) [41]. All are Tier 1.
This is where the chronology matters most. These therapies are among the most important tools in contemporary practice, and they cannot retrospectively receive credit for a decline that began decades before they existed. The Icelandic model, covering 1981–2006, assigned only 0.5% of the historical mortality decline to statin treatment while assigning 32% to falling cholesterol overall[7] — because during most of that window the population cholesterol decline was largely non-pharmacological and plausibly substantially related to dietary and food-supply change. The correct reading is not that statins are unimportant; it is that statins are important now, and were largely absent then. Any analysis that credits statins with the twentieth-century decline has the arrow of time pointing the wrong way.
Antiplatelet therapy and the secondary-prevention bundle
ISIS-2 remains one of the cleanest results in cardiovascular medicine. Among 17,187 patients with suspected acute MI, streptokinase alone reduced five-week vascular mortality from 12.0% to 9.2%; aspirin alone from 11.8% to 9.4%; and the combination from approximately 13.2% to 8.0%, an odds reduction of about 42% [18] (Tier 1). That a drug costing pennies produced a mortality benefit of that magnitude remains a useful check on therapeutic enthusiasm for expensive alternatives.
For chronic use, the Antithrombotic Trialists’ Collaboration drew the decisive distinction between prevention settings. In secondary prevention, aspirin reduced serious vascular events by 19% (6.7% versus 8.2% per year), with absolute benefit substantially exceeding bleeding risk. In primary prevention, the reduction was only 12% in major vascular events (0.51% versus 0.57% per year), driven entirely by non-fatal MI, with no significant effect on vascular mortality and offset by roughly a 42% increase in major gastrointestinal and extracranial bleeding[42]. This is why contemporary guidelines have retreated from routine primary-prevention aspirin — a rare example of the evidence base narrowing rather than expanding an indication.
Combined guideline-directed secondary prevention — antiplatelet agent, statin, ACE inhibitor or ARB, and beta-blocker — is estimated in attribution models to produce a substantial cumulative relative risk reduction when components are combined multiplicatively rather than additively. Published composite figures should be treated as modeled estimates that pool heterogeneous endpoints and trial eras rather than as a measured quantity. Real-world adherence to multi-drug regimens declines materially over the years after discharge, which is the rationale for the polypill.
At the population level, the secondary-prevention bundle made a substantial contribution. In the United States, therapies given after MI or revascularization accounted for approximately 11% of the entire 1980–2000 fall in CHD deaths — more than initial acute-MI treatment alone. Modern trials of fixed-dose combination therapy confirm the bundle’s value and demonstrate the importance of adherence as a major modifiable constraint: the SECURE trial of a post-MI polypill (aspirin, ramipril, atorvastatin) reduced the primary composite by 24% (HR 0.76, 95% CI 0.60–0.96) and cardiovascular death by 33% (HR 0.67, 0.47–0.97) [43]
Table 4 — Major medical advances
| Intervention | Adoption / evidence era | Effect on MI incidence | Effect on MI mortality | Evidence and identifier |
| Antihypertensive therapy | Effective from 1960s; widespread from 1970s | Strong prevention: ~9–11% lower major CV-event risk per 5 mmHg SBP reduction | Reduces fatal and non-fatal vascular events; substantial historical population contribution | Tier 1 RCT meta-analysis. DOI 10.1016/S0140-6736(21)00590-0; PMID 33933205[37] |
| Statins | Introduced 1987; outcome evidence 1994; mass adoption late 1990s–2000s | Strong prevention: RR 0.79 (0.77–0.81) major vascular events per 1 mmol/L LDL reduction; ~22% per mmol/L across the full programme | Vascular and all-cause mortality benefit in appropriate populations | Tier 1 IPD meta-analysis. DOI 10.1016/S0140-6736(12)60367-5; PMID 22607822[38] |
| Ezetimibe | Outcome evidence 2015 | Incremental prevention after ACS: 34.7%→32.7% composite at 7 years | Composite benefit; not primarily a mortality result | Tier 1. DOI 10.1056/NEJMoa1410489; PMID 26039521[39] |
| PCSK9 inhibition | Outcome evidence 2017–2018 | FOURIER HR 0.85; ODYSSEY HR 0.85 after ACS | Strong event prevention; mortality effect depends on population and follow-up duration | Tier 1. PMID 28304224; DOI 10.1056/NEJMoa1801174[40] |
| Aspirin (acute and secondary prevention) | Definitive 1988 | Reduces recurrent ischemic events; broad primary prevention limited by bleeding | ISIS-2: aspirin reduced acute vascular death odds ~23%; with streptokinase ~42% | Tier 1. PMID 2899772[18] |
| Aspirin (primary prevention) | Reassessed 2009–2019 | Only 12% reduction in major vascular events, driven by non-fatal MI | No significant vascular mortality effect; offset by ~42% more major bleeds | Tier 1, Antithrombotic Trialists’ Collaboration, Lancet 2009[42] |
| Beta-blockers, ACE inhibitors / ARBs | 1980s / 1990s | Modest effect on incidence | Historical post-MI and HFrEF mortality benefit established in randomized trials and meta-analysis; contemporary long-term post-MI indications depend on LV function and other indications | Tier 1[44,45,46] |
| Thrombolysis | 1986–1990s | None — reopens an artery after the event has begun | ~30 fewer deaths per 1,000 treated within 0–6 h; ~20 per 1,000 at 7–12 h in eligible ST-elevation/BBB patients | Tier 1, Fibrinolytic Therapy Trialists; PMID 7905143[47] |
| Primary PCI for STEMI | 1990s onward | None on first events; reduces reinfarction versus lysis | 23-trial synthesis: short-term death 7% vs 9%; reinfarction 3% vs 7%; stroke 1% vs 2% | Tier 1. DOI 10.1016/S0140-6736(03)12113-7; PMID 12517460[21] |
| CCU / telemetry / defibrillation | Early 1960s onward | None | Historical hospital mortality 30%→15%; one randomized comparison 15.3% vs 29.3% (RR for general ward 2.3, 95% CI 1.1–4.8)[13] | Tier 2 (single small RCT)[13] plus Tier 5 historical series[14] |
| Public-access AED | 1990s–2000s | None | PAD trial: 30 survivors of 128 definite arrests with CPR+AED versus 15 of 107 with CPR alone | Tier 1. DOI 10.1056/NEJMoa040566[48] |
| CABG | 1968 onward; trials 1972–1984 | Reduces spontaneous MI in selected anatomy | Survival benefit concentrated in left main and three-vessel disease; little or none in one- to two-vessel disease | Tier 1, Yusuf et al.[19] Lancet 1994[19] |
| PCI for stable coronary disease | 1980s onward | No general population preventive role | ISCHEMIA: no reduction in ischemic events or all-cause death over median 3.2 years; death HR 1.05 (0.83–1.32) | Tier 1. DOI 10.1056/NEJMoa1915922; PMID 32227755[49] |
| GLP-1 receptor agonists | Outcome evidence 2016–2023 | Prevention in obesity without diabetes (SELECT): MACE 6.5% vs 8.0%, HR 0.80 (0.72–0.90); separate CV outcome evidence exists in type 2 diabetes | Reduces MACE; SELECT did not establish a statistically significant reduction in cardiovascular death alone (2.5% vs 3.0%, HR 0.85, 95% CI 0.71–1.01) | Tier 1. NEJM 2023; DOI 10.1056/NEJMoa2307563[50] |
| Colchicine | Outcome evidence 2019–2020 | Reduces recurrent events in established disease | COLCOT reduced its primary composite by ~23% (HR 0.77, 95% CI 0.61–0.96)[51]; LoDoCo2 by ~31% (HR 0.69)[52] | Tier 1, but CLEAR SYNERGY/OASIS-9 was neutral (HR 0.99, 95% CI 0.85–1.16)[53] |
Part V. Rescue: how a heart attack stopped being a death sentence
The equation that separates prevention from rescue
At population level:
CHD mortality ≈ coronary-event incidence × case fatality
with additional contributions from recurrent events, out-of-hospital sudden death, competing risks, and coding. This is the equation that makes the central question answerable. If mortality falls and incidence is flat, the gain came from rescue. If mortality falls and case fatality is flat, the gain came from prevention. Usually both moved.
The WHO MONICA Project exploited exactly this across 37 populations in 21 countries over approximately 1983–1993, with standardized coronary-event ascertainment — an extraordinary logistical achievement that has never been repeated at that scale. The central finding was that, in populations where mortality declined, approximately two-thirds of the fall was attributable to declining coronary-event rates and about one-third to improving case fatality, with substantial variation by country and sex [9] (Tier 3). A companion analysis linked improvements in coronary care and secondary prevention directly to falling case fatality: for a common 20-point change in treatment score, case fatality fell about 19% in men and 16% in women, event rates about 25% and 23%, and coronary mortality about 42% and 34%.[54]
Because the MONICA age range was principally 25–64, these proportions should not be projected mechanically onto contemporary older populations, in whom the balance may differ.
Table 5 — Acute MI survival across eras
ILLUSTRATIVE HISTORICAL RANGES — NOT DIRECTLY COMPARABLE. This table is a schematic historical synthesis, not a single sourced dataset. The bands are assembled from heterogeneous cohorts, diagnostic criteria, and populations across seven decades, and the era values are therefore indicative rather than directly comparable measurements. Cross-era comparison must be interpreted cautiously, because modern high-sensitivity troponin captures smaller infarctions that earlier eras would never have counted — which by itself lowers measured case fatality. The individually sourced cohorts in the panel below carry the evidentiary weight; the era bands orient the reader.
| Era | In-hospital case fatality | 28/30-day case fatality | Major mode(s) of early death | Therapeutic environment |
| Pre-CCU, 1950–1961 | ~30% | ~40% | Sudden primary ventricular fibrillation | Strict bed rest, morphine, oxygen |
| Early CCU, 1962–1975 | ~15% | ~25% | Cardiogenic shock; progressive pump failure | Continuous telemetry, DC defibrillation, lidocaine |
| Early reperfusion, 1976–1989 | ~10% | ~15–20% | Cardiogenic shock; free-wall rupture | IV thrombolysis, acute oral aspirin, beta-blockade |
| Primary PCI and stents, 1990–2009 | ~5–7% | ~10% | Cardiogenic shock; multiorgan failure | Primary PCI (<90 min door-to-balloon), DAPT, ACE inhibition |
| Contemporary networks, 2010–2026 | ~4–6% | ~7–9% | Non-cardiac comorbidity; refractory shock | Radial-first PPCI, selective mechanical circulatory support, potent P2Y12 inhibitors, guideline-directed secondary prevention |
Corroborating community and cohort data
| Source | Finding |
| Worcester Heart Attack Study, 1975–2005 | Hospital survival after an initial AMI improved from 81% (1975) to 91% (2005) — i.e. in-hospital death fell from roughly 19% to 9% — community-wide, not selected centers[55]. Age-adjusted in-hospital case fatality had already fallen from 22.2% (1975) to 15.1% (1984) in the same community[56] |
| Framingham, 1960s→1990s | Crude 30-day 20%→14%; age- and sex-adjusted case fatality at 30 days, 1 year, and 5 years each ~60% lower |
| ARIC, 1987–2008 | 28-day case fatality fell ~2.6–3.6% per year depending on sex/race group |
| MIYAGI, Japan, 1979→2008 | Age-adjusted in-hospital mortality 20.0%→7.8% — while incidence rose |
| Randomized CCU comparison[13] | 15.3% (17/111, CCU) vs 29.3% (27/92, general ward); RR for death on general ward 2.3 (95% CI 1.1–4.8) |
A further discrete gain came with the SHOCK trial,[57] which showed a longer-term survival benefit from early revascularization compared with initial medical stabilization, although its primary 30-day mortality comparison did not reach statistical significance. It addressed the failure mode that had replaced ventricular fibrillation as the leading cause of in-hospital death once the coronary care unit had largely solved the arrhythmia problem.
The interventions, in causal perspective
The coronary care unit attacked the failure mode that killed people in the first hours: ventricular fibrillation. It required no drug, only continuous observation and a defibrillator in the room. Its evidence base is weaker than its plausibility, but the temporal signal is large and consistent.
CPR and public-access defibrillation attack the same failure mode outside hospital, where most sudden cardiac deaths occur. The randomized Public Access Defibrillation Trial found 30 hospital survivors among 128 definite cardiac arrests in communities assigned CPR plus AED training, versus 15 among 107 in CPR-only communities [48] (Tier 1). This is a category of benefit invisible to hospital statistics, because the patients concerned would previously have died before reaching hospital at all — and it lowers coronary mortality without reducing the incidence of the underlying atherosclerotic event.
Fibrinolysis was a genuine mortality breakthrough. The Fibrinolytic Therapy Trialists’ overview of roughly 58,600 randomized patients found an absolute benefit on the order of 30 fewer deaths per 1,000 when treatment began within six hours and about 20 per 1,000 at 7–12 hours, in patients with ST elevation or bundle branch block — with no benefit, and possible harm, in those without [47] The proportional reduction in 35-day mortality was approximately 18%.
Primary PCI then improved on fibrinolysis. Keeley and colleagues’ meta-analysis of 23 trials and 7,739 patients found short-term mortality of 7% with primary angioplasty versus 9% with thrombolysis, reinfarction 3% versus 7%, stroke 1% versus 2%, and the composite of death, reinfarction, or stroke 8% versus 14% [21]
Emergency medical systems, prehospital ECG, and STEMI networks are not treatments but the delivery mechanism that determines whether the treatments arrive in time. Their contribution is real and largely invisible to attribution models, because it is embedded in the observed case-fatality improvement rather than appearing as a separate line item.
Japan: the decisive counterexample
Any claim that falling coronary mortality necessarily means fewer heart attacks is refuted by Japan. In the MIYAGI-AMI registry of 22,551 patients, age-adjusted acute MI incidence rose from 7.4 to 27.0 per 100,000 between 1979 and 2008, while age-adjusted in-hospital mortality fell from 20.0% to 7.8% as ambulance use and primary PCI expanded [58]. The registry also reported markedly higher 2008 mortality in women than men — 12.2% versus 6.3% — a sex disparity also reported in other populations, including contemporary U.S. data in young adults.[59]
The Akita–Osaka study[60] similarly found heterogeneous long-term Japanese trends, with age-adjusted MI incidence in urban men rising from 45 per 100,000 in 1964–1971 to 90 per 100,000 in 1996–2003, alongside worsening cholesterol and BMI but declining smoking. Western trajectories are not universal, and a country can achieve dramatic survival gains while losing ground on prevention.
Part VI. Revascularization: three different operations wearing one name
“Revascularization” is not a single causal category, and treating it as one is among the most common analytic errors in this literature.
Primary PCI for ST-elevation infarction is emergency reperfusion of an occluded artery in a patient who is currently infarcting. It saves lives, as above.
CABG in selected anatomy prolongs life. Two distinct evidence bases should not be merged. On coronary anatomy, CASS and the Veterans Administration Cooperative Study supported survival benefit in left main stenosis and three-vessel disease with proximal LAD involvement. On ischemic cardiomyopathy with severe left ventricular dysfunction — a different population defined by ventricular function rather than anatomy — STICH and its extended follow-up demonstrated a long-term survival benefit from surgical revascularization added to medical therapy.[61] FREEDOM subsequently showed that in diabetic multivessel disease, CABG reduced death and MI compared with stenting.[62] Yusuf’s meta-analysis of seven randomized trials and 2,649 patients from 1972–1984 found the survival benefit concentrated in left main disease (five-year odds ratio 0.32) and three-vessel disease (OR 0.58), with little or no benefit in one- to two-vessel disease, and an overall absolute survival advantage of roughly 4% at ten years.[19]
Elective PCI for stable coronary disease is predominantly a symptom-relief procedure. COURAGE (2007) found no reduction in death or MI versus optimal medical therapy.[63] ORBITA, using a sham-controlled design, found a far smaller symptomatic effect than expected.[64] ISCHEMIA — the largest and most definitive trial — randomized patients with moderate or severe ischemia and found five-year primary-outcome estimates of 16.4% versus 18.2% for invasive versus conservative strategies, a difference of −1.8 percentage points (95% CI −4.7 to 1.0), with all-cause death HR 1.05 (0.83–1.32) [49] ISCHEMIA-EXTEND, at a median 5.7 years, showed no all-cause mortality difference, with a modest reduction in cardiovascular death offset by an increase in non-cardiovascular death.[65]
Across IMPACT models, CABG in chronic and post-MI cohorts accounted for roughly 3–5% of the total CHD mortality decline, while elective PCI in stable disease contributed on the order of 1–2%.
This explains an otherwise puzzling finding: despite an enormous growth in procedure volume, revascularization for chronic angina accounted for only about 5% of the U.S. 1980–2000 CHD mortality decline in the IMPACT model. Much of the growth in procedure volume occurred in settings where a population survival benefit was not established.
Table 6 — Prevention versus rescue
| Intervention | Prevents first MI? | Prevents recurrent MI? | Reduces death during/after MI? | Primary historical role |
| Tobacco control and smoking cessation | Yes | Yes | Indirectly | Population prevention |
| Lower population LDL/ApoB via food supply and diet | Yes | Yes | Indirectly | Population prevention |
| Salt reduction / salt substitution | Yes (via BP) | Yes | Indirectly | Population prevention |
| Statins and intensive LDL lowering | Yes in appropriate primary prevention | Yes, strongly | Yes, via fewer events | Preventive / chronic medicine |
| Antihypertensive therapy | Yes | Yes | Yes, via fewer vascular events | Preventive / chronic medicine |
| GLP-1 receptor agonists | Reduces MACE in selected high-risk obesity/T2D populations | Yes | Indirectly | Preventive / cardiometabolic |
| Aspirin | Limited by bleeding; not universally indicated | Yes | Yes in acute MI | Secondary prevention plus acute therapy |
| Cardiac rehabilitation and comprehensive secondary prevention | No effect on an event already occurring | Yes | Improves subsequent prognosis | Secondary prevention |
| CCU and telemetry | No | Not directly | Yes | Acute rescue |
| CPR, AED, defibrillation | No | No | Yes, dramatically in shockable arrest | Emergency rescue |
| EMS, prehospital ECG, STEMI networks | No | Not directly | Yes, by reducing treatment delay | Health system / acute rescue |
| Thrombolysis | No | Reduces acute reinfarction consequences | Yes | Reperfusion rescue |
| Primary PCI for STEMI | No | Reduces reinfarction versus lysis | Yes | Acute reperfusion |
| Elective PCI for stable CHD | No demonstrated population role | Not a substitute for intensive medical prevention | No clear survival advantage over good medical therapy | Symptom relief; selected anatomy |
| CABG | Not population first-MI prevention | Improves prognosis in selected high-risk anatomy | Yes in selected disease; also symptom relief | Chronic disease revascularization |
| Troponin and improved diagnosis | No biological prevention | Enables treatment targeting | May improve care indirectly | Diagnosis; also changes measured incidence and case fatality |
Part VII. Counterfactuals and lives saved
What if a modern population had old medical care — or old risk factors?
Neither question has ever been randomized, and neither can be answered precisely. The closest defensible calculations come from the U.S. IMPACT model, which uniquely reports absolute numbers. What follows is an arithmetic counterfactual derived from that attribution model — adding modeled deaths-prevented-or-postponed back onto observed deaths. It is an illustrative reconstruction, not a validated simulation of what would happen if an intervention were withdrawn.
Modern risk factors, 1980-vintage treatment. Observed CHD deaths in the modeled age range in 2000 were approximately 337,658. Removing the estimated benefit of treatment improvements since 1980 would add roughly 159,330 deaths, yielding approximately 496,988 — about 47% more than observed, while retaining the modeled risk-factor improvements.
Modern treatment, 1980-vintage risk factors. Retaining 2000 treatment but reversing the modeled 1980–2000 risk-factor improvement adds about 149,635 deaths, yielding roughly 487,293 — about 44% more than observed.
Two cautions are essential. First, these are 1980-care and 1980-risk counterfactuals, not 1950s ones. Mid-century care lacked coronary care units, modern defibrillation systems, thrombolysis, PCI, statins, and essentially all evidence-based secondary prevention, so a true 1950s counterfactual would be considerably worse — but no validated model supports a specific number, and extrapolating backward would be invention. Likewise, restoring actual 1950s smoking, cholesterol, and blood-pressure distributions would produce a larger effect than reversing the 1980–2000 changes alone.
Second, and more interestingly, the two counterfactuals are nearly symmetrical. In the United States between 1980 and 2000, removing either modern treatment gains or favorable risk-factor gains would have erased a comparably enormous fraction of the progress. This symmetry provides a strong argument against the entire “medicine versus lifestyle” framing: both made comparably large contributions, and presenting the history as either medicine or risk-factor change is misleading. It does not establish that either pathway alone would have failed — each alone would still have produced substantial mortality reduction.
How many lives were saved?
The scientifically defensible term is deaths prevented or postponed, because no model can establish that a person who avoided a coronary death in a given year gained a specific number of life-years.
Three U.S. point-counterfactuals convey the scale:
- Had 1980 age-specific CHD death rates persisted into the year 2000 population, there would have been an additional 341,745 CHD deaths in that single year. Of these, approximately 159,330 were attributed to treatment and 149,635 to risk-factor change; the model explained about 90% of the observed difference.
- Had the 1963S. peak CHD mortality rate persisted, there would have been roughly 1.076 million CHD deaths in 1994 rather than about 482,000 — approximately 594,000 deaths avoided or postponed in that year alone.
- CDC’s historical analysis similarly estimated approximately 621,000 fewer CHD deaths in 1996 than if the 1963 peak rate had persisted.
The decline in cardiovascular mortality also contributed materially to gains in adult longevity: cardiovascular disease was the dominant cause of adult death, and its retreat is among the largest contributors to twentieth-century adult survival gains in high-income countries. This review does not estimate a global cumulative number of deaths prevented, nor a specific number of life-years gained, because it cites no dedicated demographic decomposition capable of supporting such a figure. The aggregate global “deaths prevented” figure is far softer, depends entirely on the counterfactual baseline chosen, and should not be quoted as a precise number without independent verification.
These figures must not simply be summed across years to produce a cumulative count of unique people saved. The same individual can have death postponed across many counterfactual years; the population’s age structure changes; competing non-coronary mortality changes; and the baseline rate is itself a counterfactual. A rigorous century-long cumulative “lives saved” total is therefore unspecified rather than falsely precise. What can be said is that single-year estimates against the 1963 peak-rate counterfactual are of the order of half a million to six hundred thousand deaths prevented or postponed in the mid-1990s — a scale of benefit with few parallels in the history of medicine. No verified continuous annual series exists across the following three decades, and none is asserted here.
Part VIII. International natural experiments
Attribution models are inference. Natural experiments — where a population’s risk factors changed sharply and mortality followed — provide stronger triangulating evidence, although they remain non-randomized and potentially confounded by concurrent secular change.
Finland and North Karelia
The Finnish experience is one of the most informative population-level natural experiments in the field, because the risk-factor changes were deliberately engineered, documented prospectively, and preceded the mortality change.
In the early 1970s, North Karelia recorded among the highest coronary mortality rates then documented anywhere, particularly among middle-aged working-age men in eastern Finland. A community-based program launched in 1972 — working through village organizations, schools, food producers, dairy cooperatives, and eventually national legislation — systematically reduced smoking, saturated fat intake, and blood pressure. Working-age male coronary mortality in eastern Finland fell from 643 to 118 per 100,000 between the early 1970s and 2012 (−82%), and female mortality from 114 to 17 (−84%).[66]
The within-community analyses estimated that observed reductions in the three classical risk factors predicted the great majority of the first-period decline in ischemic heart disease incidence in North Karelia — far more than in the reference area[35] — evidence about incidence, not merely mortality, and therefore evidence about prevention rather than rescue.[67] Even in the later decades of follow-up, the three classical risk factors continued to explain a substantial share of the ongoing decline. The national Finnish IMPACT analysis nevertheless assigned treatment a meaningful 23% share for 1982–1997[5], demonstrating once again that this is not an either/or.
Iceland
Iceland offers the cleanest quantitative demonstration that fewer events, not merely better survival, drove the mortality fall: coronary mortality fell 80% and MI incidence fell 66% between 1981 and 2006. The model attributed 73% of the mortality decline to risk-factor change and 25% to treatment, with cholesterol contributing 32%, smoking 22%, and systolic blood pressure 22%.[7] Within the treatment share: secondary prevention 8%, heart-failure treatment 6%, acute coronary syndrome treatment 5%, revascularization 3%, hypertension treatment 2%, and statins 0.5%.
Sweden
Coronary mortality fell approximately 53% in men and 52% in women from 1986–2002, with 55% attributed to risk-factor reduction and 36% to treatment.[6] The detailed follow-up analysis provides the field’s best worked example of separating diet from pharmacology within a single risk factor, and established that roughly three-quarters of the risk-factor-attributable benefit occurred in people without diagnosed coronary disease.
England and Wales
The 1981–2000 decline was 62% in men and 45% in women aged 25–84, with treatment explaining 42% and risk-factor change 58%.[4] The distinguishing feature is that smoking reduction alone accounted for 48% of the modeled decline — a reminder that where a population’s dominant exposure is unusually severe, its reversal dominates everything else. Acute MI treatment contributed about 8%.
United States
The most complete accounting, and the one with absolute numbers, as described above: 44% risk factors, 47% treatment, ~9% unexplained, 341,745 deaths prevented or postponed in the year 2000 alone.
Poland: an accidental national experiment in the food supply
Poland provides a particularly informative natural experiment bearing on the dietary hypothesis, because the change was economic rather than medical and was not primarily initiated as a cardiovascular health-service intervention. It was emphatically not a controlled test: the post-communist transition changed incomes, employment, healthcare, and much else simultaneously. After the 1991 economic transition, consumer subsidies on butter and lard were removed while trade liberalization made imported rapeseed and soybean oils cheap and available. Within roughly three years, animal fat consumption fell about 20%, vegetable oil consumption doubled, and fruit and vegetable intake rose.
Between 1991 and 2005, age-adjusted coronary mortality in Poland fell 54%, corresponding to approximately 26,200 deaths avoided in 2005. The Polish IMPACT model attributed roughly 54% of the decline to dietary fat substitution and increased physical activity, and 37% to medical therapy [33] Poland matters because the change in exposure was abrupt, externally imposed, not designed as a health-service intervention, and followed by a mortality change of the predicted direction and magnitude.
Russia and the post-Soviet surge: the experiment run in reverse
The dissolution of the Soviet Union produced the mirror image. Economic collapse, social disruption, hazardous binge consumption of high-proof spirits, and the breakdown of routine chronic disease care were followed by a very large increase in cardiovascular mortality during the 1990s in the Russian Federation, with reported increases of roughly 35–45%.[68] Comparable directional deterioration occurred in several neighboring post-Soviet states, though the precise magnitude there requires country-specific sources.
This provides especially compelling evidence that the century’s gains are not automatic, irreversible, or purely technological. A population with essentially unchanged medical knowledge lost decades of cardiovascular progress in under ten years because its social and behavioral conditions deteriorated. Any account that treats the coronary decline as a ratchet driven by accumulating medical capability cannot explain Russia.
The Netherlands
Coronary mortality fell 48% between 1997 and 2007 (269 to 141 per 100,000), with approximately 37% attributed to treatment and 36% to risk-factor change — notable for systolic blood pressure dominating the risk-factor share at about 30%. The model explained roughly 72% of the observed decline, leaving an unusually large residual.[34]
Japan
Discussed above: rising incidence, sharply falling case fatality. Japan also illustrates the limits of extrapolating Western attribution percentages to populations with different baseline diets, lipid distributions, and stroke-versus-coronary disease balance.
Global divergence
The high-income experience is not the world’s experience. While high-income countries recorded large declines in age-standardized cardiovascular mortality in recent decades, the picture elsewhere is heterogeneous by GBD region rather than a simple high-income/low-income binary. Many countries have seen rising absolute cardiovascular burden from population growth and aging while their age-standardized rates fell; in some regions age-standardized rates have also stagnated or risen, driven by urbanization, tobacco, the penetration of processed foods, and limited access to both prevention and acute care.[24] The global coronary epidemic is not uniformly ending; in much of the world it is still ascending in absolute terms.
Table 7 — Natural experiments in cardiovascular epidemiology
| Region / context | Window | Structural driver | Mortality trend | Principal factors identified |
| North Karelia and Finland | 1972–2012 | Designed community intervention; dairy fat replaced with plant oils; salt reduction | >80% decline in working-age CHD mortality | Cholesterol reduction dominant; smoking cessation; BP control |
| Poland | 1991–2005 | Removal of animal-fat subsidies; imported vegetable oils | −54% | Saturated fat replaced by PUFA; increased physical activity |
| Iceland | 1981–2006 | Modernization, universal healthcare, tobacco and diet policy | −80%; incidence −66% | Cholesterol −32%, smoking −22%, SBP −22%; treatment 25% |
| Russian Federation | 1990–1998 | Socioeconomic collapse; disruption of chronic care | +35% to +45% increase | Hazardous alcohol use; socioeconomic disruption; health-system deterioration |
| Japan (Miyagi) | 1979–2008 | Westernizing risk profile with rapidly modernizing acute care | Incidence +265%; in-hospital mortality −61% | Rescue improved while prevention deteriorated |
| Global regional divergence | 1990–2026 | Divergent risk transition and health-system capacity | Large age-standardized declines in high-income regions; heterogeneous elsewhere, with absolute burden rising in most regions | Prevention and guideline-directed therapy uptake versus urbanization, tobacco, processed foods; see GBD region-specific estimates[24] |
Part IX. The stall, and who has been left behind
Three uncomfortable observations belong in any honest account.
Progress has slowed and, in places, reversed. The rate of decline in U.S. and U.K. coronary mortality attenuated markedly after roughly 2011. Adults under 55 — particularly women — show flattening or reversal. Wilmot and colleagues documented stagnation in young adults through 2011,[22] and a 2026 analysis of 945,977 first acute myocardial infarction hospitalizations in U.S. adults aged 18–54 found that adjusted in-hospital mortality after a first STEMI rose by 1.2 percentage points in absolute terms between 2011 and 2022, while first-NSTEMI mortality was essentially unchanged.[59] Young women fared worse than young men (STEMI 3.1% vs 2.6%; NSTEMI 1.0% vs 0.8%), and non-traditional risk factors — low income, kidney disease, non-tobacco drug use — were more strongly associated with death than traditional ones. Note that this measures case fatality among those hospitalized, not a population death rate. The causes of this worsening in-hospital STEMI mortality are not established; the study itself found non-traditional factors more strongly associated with death than traditional ones. At the population level, obesity and type 2 diabetes remain major counterweights to long-term coronary progress, and many major attribution models have flagged them as negative contributions since the 1990s — but they should not be assumed to explain the specific rise in young-adult in-hospital STEMI mortality.
Hypertension control has deteriorated in the United States. Using the traditional <140/90 mmHg threshold, control among U.S. adults with hypertension peaked around 2013–2014 at approximately 53.8% and fell to 43.7% by 2017–2018.[25] Under the stricter 2017 ACC/AHA definition (<130/80 mmHg), only 20.7% of U.S. adults with hypertension were controlled during August 2021–August 2023, with no significant change from 2017–March 2020.[69] The threshold and denominator must always be specified, because these figures are not interchangeable — a reversal of decades of improvement in one of the largest population-attributable cardiovascular risks globally.[24] This is substantially an implementation and health-system failure rather than a lack of effective therapy — and it is reversible, though socioeconomic, measurement, and biological factors also contribute.
The gains have not been shared equally. ARIC found incident MI declining at only 1.5% per year in Black men versus 3.4–4.3% in other groups over 1987–2008.[29] The Miyagi registry found in-hospital mortality of 12.2% in women versus 6.3% in men in 2008.[58] Socioeconomic and geographic gradients in coronary mortality persist and in several countries have widened, even as national averages improved. A national average that improves while a subgroup stagnates is a partial success being reported as a complete one.
Globally, GBD identifies high systolic blood pressure, dietary risk, high LDL cholesterol, and air pollution among the largest contributors to cardiovascular burden, while high BMI and hyperglycemia have worsened.[24] In much of the world, the coronary epidemic is not in retreat at all — it is in its ascending phase, in countries with far less capacity to deploy either prevention or rescue.
Part X. What comes next: doing better than we are doing today
The last hundred years were won with tobacco control, the food supply, blood pressure, cholesterol, and the emergency reperfusion of occluded arteries. Future progress cannot rely solely on repeating those strategies — though substantial gains remain available from implementing them better, particularly outside high-income countries.
One structural fact should govern planning. The marginal population gains available from further reducing already-low in-hospital STEMI mortality are likely smaller than those available from prevention. With in-hospital STEMI case fatality compressed to roughly 4–7%, even halving it again would move population coronary mortality only modestly. This does not mean acute care is finished: substantial opportunity remains in out-of-hospital cardiac arrest survival, cardiogenic shock, reperfusion delay, systems of care, and the disparities documented above — and the 2026 young-adult data show acute outcomes can deteriorate. But a larger share of future gains will probably need to come from preventing events rather than surviving them.
Seven directions have the strongest claim.
1. Treat cumulative lifetime exposure, not middle-aged thresholds
This is an important conceptual shift, and it requires no new drug. Mendelian randomization studies indicate that genetically mediated lifelong lower LDL confers a risk reduction several-fold greater per unit of LDL than the same reduction achieved for five years in a middle-aged trial population — the difference between roughly 22% per mmol/L over a trial[31] and a far larger effect over a lifetime.[32] Atherosclerotic risk depends strongly on cumulative atherogenic-particle exposure over time — along with blood pressure, smoking, glycemia, inflammation, and genetic factors — rather than on a cholesterol value measured on a given morning at age 55.
The practical implications are substantial: consider apolipoprotein B in addition to LDL-C — particularly where LDL-C and ApoB are discordant, or in metabolically high-risk patients — since ApoB counts atherogenic particles directly;[32] initiate treatment earlier in people with clearly elevated lifetime exposure rather than relying solely on a ten-year risk threshold that is strongly age-dependent and can understate lifetime risk in younger patients; and use short-term risk scores alongside an assessment of cumulative lifetime exposure, rather than allowing the score alone to determine treatment.
2. Finally treat lipoprotein(a)
Roughly one in five people carries an elevated Lp(a) depending on the threshold used, it is almost entirely genetically determined, it is causally associated with atherosclerotic disease and aortic stenosis, and neither statins nor ezetimibe lower it meaningfully. It is a major common causal risk factor for which outcome-proven targeted therapy remains unavailable, and it remains substantially undermeasured in routine practice — despite requiring, in most people, only a single lifetime test.
RNA-targeted therapeutics now lower it dramatically: pelacarsen (antisense) by roughly 80%, olpasiran and lepodisiran (siRNA) by approximately 90–94%, with oral small-molecule approaches such as muvalaplin in earlier development.[70,71,72,73,74] Phase 3 cardiovascular outcome trials are ongoing; as of August 2026, definitive cardiovascular outcome results have not been reported, and the field should not pre-commit to a result. One-time measurement in adulthood is already endorsed by major contemporary society and consensus statements;[75] the outcome trials are needed principally to establish whether targeted treatment improves outcomes. Positive results would strongly reinforce systematic one-time measurement and could make Lp(a) lowering a major addition to preventive cardiology.
3. Extend the lipid-lowering toolkit and solve adherence
Inclisiran offers siRNA-based LDL lowering with twice-yearly maintenance dosing after initial and three-month doses, converting adherence from a daily behavioral problem into a scheduled clinical event; a direct cardiovascular outcome benefit has not yet been established, with ORION-4 ongoing. Bempedoic acid provides a non-statin option with demonstrated outcome benefit for the statin-intolerant.[76] Obicetrapib and other agents remain investigational, with cardiovascular outcome data still pending.
Fixed-dose combination therapy addresses the same problem from the other direction. SECURE (post-MI polypill) reduced the primary composite by 24%;[43] PolyIran reduced major cardiovascular events with HR 0.66 in a primary-prevention population;[77] TIPS-3 showed HR 0.69 for polypill plus aspirin.[78] The consistent finding is that adherence is one of the major limiting factors in secondary prevention — alongside residual risk, undertreatment, clinical inertia, and access.
4. Treat the cardiometabolic driver directly
Obesity and diabetes have been major counterweights to progress for thirty years, and until recently there was no pharmacotherapy producing weight loss of this magnitude while also improving cardiometabolic risk and cardiovascular outcomes. SELECT changed that: in 17,604 patients with obesity and cardiovascular disease but without diabetes, semaglutide reduced major adverse cardiovascular events from 8.0% to 6.5%, HR 0.80 (95% CI 0.72–0.90).[50] Cardiovascular death alone was not significantly reduced (2.5% vs 3.0%; HR 0.85, 95% CI 0.71–1.01), so the benefit is established for the composite rather than for cardiovascular mortality specifically. SGLT2 inhibitors reduce heart failure events and cardiovascular death in heart-failure and chronic kidney disease populations, including people without diabetes; they are not established as generic primary prevention in all non-diabetic adults. Dual and triple incretin agonists are in outcome trials.
If these agents can be deployed at population scale — which is at present a pricing, supply, and health-system question far more than a scientific one — they address the specific factor that has been subtracting from the ledger since 1990. That is one plausible route to helping restart the stalled decline.
5. Address residual inflammatory risk
CANTOS provided randomized evidence supporting the inflammatory hypothesis: canakinumab reduced recurrent events by roughly 15% with no lipid change, though without an all-cause mortality benefit and without ever being approved for this indication.[79] Colchicine at 0.5 mg daily reduced the primary composite by about 23% in COLCOT (HR 0.77, 95% CI 0.61–0.96)[51] and about 31% in LoDoCo2 (HR 0.69)[52]. The subsequent CLEAR SYNERGY (OASIS-9) trial in 7,062 patients after acute MI was neutral (9.1% vs 9.3%; HR 0.99, 95% CI 0.85–1.16),[53] introducing genuine uncertainty about which patients benefit. Ziltivekimab, targeting interleukin-6, is in outcome trials. Residual inflammatory risk is real; the optimal agent and the right patient are not yet settled.
6. Find the people at risk before the event
Coronary artery calcium scoring can refine risk classification when conventional ten-year estimates leave treatment decisions uncertain, and a score of zero is a powerful negative predictor.[80] Polygenic risk scores add independent information, particularly in the young, though their clinical utility across ancestries remains uneven.
More consequentially: familial hypercholesterolemia affects roughly one in 250 people, causes premature coronary death, is readily screenable with a lipid panel, is highly treatable, and remains largely undiagnosed.[81] Diagnosis requires clinical, family, and often genetic context plus exclusion of secondary causes, but screening itself is simple. Universal lipid screening in childhood with cascade screening of families is recommended by several professional societies, though guideline consensus and implementation both remain incomplete.
7. Population policy retains exceptionally large leverage
Population policies shift exposure across entire distributions rather than acting only on the motivated minority who attend clinics, and therefore carry unusually large potential leverage. The evidence base is not uniform across them: industrial trans-fat elimination, sodium reduction, and tobacco control have the strongest support for hard cardiovascular outcomes, whereas sugar taxation and some dietary reformulation policies currently rest on more indirect evidence.
The SSaSS trial demonstrated this with randomized evidence: in 20,995 participants followed a mean 4.74 years, replacing salt with a 75% sodium chloride / 25% potassium chloride substitute reduced stroke (rate ratio 0.86, 95% CI 0.77–0.96, P=0.006), major cardiovascular events by 13%, and all-cause death by 12%.[82] In this high-risk rural population, a low-cost dietary substitution produced clinically important outcome benefits; generalizability to lower-risk settings is less certain.
And above all: close the implementation gap
One of the largest potentially available gains today is not a new molecule. It is the distance between what the evidence supports and what patients actually receive. Fewer than half of American adults with hypertension are controlled to conventional targets.[25] European registry surveillance of coronary patients has repeatedly documented large shortfalls in risk-factor control and low uptake of cardiac rehabilitation after an acute event.[83] Many high-risk patients leave hospital after an infarction without guideline-recommended intensive lipid lowering; Lp(a) remains undermeasured in routine practice; and familial hypercholesterolemia commonly goes undiagnosed for decades.[81]
The awareness–treatment–control cascade for hypertension and lipids leaks at every stage, and many of these gaps are amenable to established policy and delivery interventions. Closing those gaps with drugs that came off patent years ago would plausibly yield a very large mortality benefit. No model is cited here comparing that benefit against the expected yield of the next decade of pharmaceutical innovation, and the comparison should be read as an unquantified judgment rather than an estimate.
Table 8 — The forward agenda
| Lever | Mechanism | Current evidence status | Plausible scale of benefit |
| Lifetime ApoB/LDL exposure reduction, earlier initiation | Reduces cumulative atherogenic particle-years | Mendelian randomization plus trial extrapolation; no long-horizon RCT | Potentially very large; hardest to prove |
| Lp(a) lowering | Targets a major common causal lipid risk not addressed by conventional LDL-lowering therapy | Potent lowering proven; phase 3 outcome trials ongoing, definitive results not reported as of August 2026 | Large if positive; unknown until then |
| GLP-1 and incretin therapies | Addresses the obesity/diabetes counterweight | Tier 1 (SELECT); more trials reading out | Large; constrained by cost and access |
| Polypill and adherence engineering | Converts proven efficacy into realized benefit | Tier 1 (SECURE, PolyIran, TIPS-3) | Moderate–large, especially in secondary prevention |
| Anti-inflammatory therapy | Addresses residual inflammatory risk | Tier 1 but heterogeneous; patient selection unresolved | Moderate |
| Salt substitution and sodium policy | Population-wide BP reduction | Tier 1 (SSaSS) | Large at population scale, very low cost |
| Tobacco endgame policy | Reduces residual smoking burden | Strong policy evidence | Moderate in high-income, very large globally |
| CAC, polygenic scores, FH cascade screening | Finds high-risk individuals before events | Good evidence; poor implementation | Moderate; concentrated in the young |
| Closing the control cascade | Delivers existing therapy to existing patients | Strong; implementation is a major limiting factor | Potentially very large near-term gain |
Evidence hierarchy and the evidence ledger
Tier 1 — randomized trials and meta-analyses establish that lowering LDL, lowering blood pressure, giving aspirin and reperfusion in acute MI, and providing primary PCI promptly rather than fibrinolysis in appropriate STEMI patients, causally reduce events or death. They do not tell us how much of a country’s forty-year mortality decline came from each intervention, because that additionally requires population uptake data.
Tier 2 — cohorts and natural experiments (Framingham, North Karelia) reveal long-term changes in incidence, risk factors, and survival, and strengthen causal interpretation of population prevention.
Tier 3 — surveillance (CDC/NCHS, ARIC, MONICA, national registries) provides the strongest evidence that population event and mortality rates actually changed.
Tier 4 — IMPACT attribution models, which incorporate externally estimated causal effect sizes rather than independently identifying causal effects, are the only practical way to partition an observed national decline among dozens of treatments and risk factors simultaneously. Their percentages are model-dependent and must never be presented as though they came from randomized experiments.
Tier 5 — historical inference is unavoidable for the early CCU era and for 1925–1950, when modern event definitions and surveillance did not exist.
Evidence ledger
| Study | Main quantitative finding used here | Access status | Tier | Identifier |
| Ford et al., NEJM 2007 | U.S. 1980–2000: 47% treatment, 44% risk factors; 341,745 fewer deaths | Full text reviewed | 4 | DOI 10.1056/NEJMsa053935; PMID 17554120 |
| Unal et al., Circulation 2004 | England/Wales: 42% treatment, 58% risk factors; smoking 48% | Abstract reviewed | 4 | PMID 14993137 |
| Laatikainen et al., Am J Epidemiol 2005 | Finland: treatment 23%, risk factors 53–72% | Abstract reviewed | 4 | DOI 10.1093/aje/kwi274; PMID 16150890 |
| Björck et al., Eur Heart J 2009 | Sweden: 36% treatment, 55% risk factors | Abstract reviewed | 4 | DOI 10.1093/eurheartj/ehn554; PMID 19141562[6] |
| Björck et al., PLoS One 2015 | Swedish diet/statin/BP partition; double-counting method | Full text reviewed | 4 | DOI 10.1371/journal.pone.0124769; PMID 25942424[10] |
| Aspelund et al., PLoS One 2010 | Iceland: mortality −80%, incidence −66%; risk factors 73%, treatment 25%, statins 0.5% | Full text openly available | 4 | DOI 10.1371/journal.pone.0013957; PMID 21103050[7] |
| Tunstall-Pedoe et al., Lancet 1999 | MONICA: ~two-thirds event rates, ~one-third case fatality | Abstract/reference record reviewed | 3 | DOI 10.1016/S0140-6736(99)04021-0; PMID 10334252 |
| Parikh et al., Circulation 2009 | Framingham: ECG-MI incidence −50%; adjusted case fatality −60% | Full PMC text reviewed | 2 | DOI 10.1161/CIRCULATIONAHA.108.825364; PMID 19237656[28] |
| Rosamond et al., Circulation 2012 | ARIC incidence and 28-day case-fatality declines; Black men 1.5%/yr | Open full text | 3 | DOI 10.1161/CIRCULATIONAHA.111.047480; PMID 22420957[29] |
| King et al., J Am Heart Assoc 2025 | U.S. 1970–2022: IHD −81%, AMI mortality −89% | Full/open article record reviewed | 3 | DOI 10.1161/JAHA.124.038644; PMID 40557798[2] |
| BPLTTC, Lancet 2021 | ~10% MACE reduction per 5 mmHg SBP; 344,716 participants | Detailed record; free PMCID | 1 | DOI 10.1016/S0140-6736(21)00590-0; PMID 33933205[37] |
| CTT Collaboration, Lancet 2012 | MVE RR 0.79 per 1 mmol/L LDL reduction | Abstract/full-text metadata reviewed | 1 | DOI 10.1016/S0140-6736(12)60367-5; PMID 22607822[38] |
| ISIS-2, Lancet 1988 | Aspirin and streptokinase acute-MI mortality effects | Abstract/results reviewed | 1 | PMID 2899772 |
| Fibrinolytic Therapy Trialists, Lancet 1994 | ~30 fewer deaths/1,000 treated within 6 h | Abstract reviewed | 1 | PMID 7905143 |
| Keeley et al., Lancet 2003 | Primary PCI vs thrombolysis: death 7% vs 9% | Complete abstract reviewed | 1 | DOI 10.1016/S0140-6736(03)12113-7; PMID 12517460[21] |
| PAD Trial, NEJM 2004 | CPR+AED roughly doubled survivor count vs CPR-only | Publisher abstract/methods reviewed | 1 | DOI 10.1056/NEJMoa040566 |
| Maron et al. (ISCHEMIA), NEJM 2020 | No death/ischemic-event advantage from routine invasive strategy | Full text reviewed | 1 | DOI 10.1056/NEJMoa1915922; PMID 32227755[49] |
| Yusuf et al., Lancet 1994 | CABG survival benefit in left main and three-vessel disease | Abstract reviewed | 1 | CABG Trialists Collaboration |
| Cannon et al. (IMPROVE-IT), NEJM 2015 | Ezetimibe + statin 32.7% vs 34.7% at 7 years | Complete abstract reviewed | 1 | DOI 10.1056/NEJMoa1410489; PMID 26039521[39] |
| Sabatine et al. (FOURIER), NEJM 2017 | Evolocumab HR 0.85 primary endpoint | Complete abstract reviewed | 1 | PMID 28304224 |
| Schwartz et al. (ODYSSEY OUTCOMES), NEJM 2018 | Alirocumab HR 0.85 MACE after ACS | Complete abstract reviewed | 1 | DOI 10.1056/NEJMoa1801174; PMID 30403574 |
| Lincoff et al. (SELECT), NEJM 2023 | Semaglutide MACE 6.5% vs 8.0%, HR 0.80 | Complete abstract reviewed | 1 | DOI 10.1056/NEJMoa2307563[50] |
| Neal et al. (SSaSS), NEJM 2021 | Salt substitute: stroke RR 0.86; all-cause death −12% | Complete abstract reviewed | 1 | DOI 10.1056/NEJMoa2105675[82] |
| Castellano et al. (SECURE), NEJM 2022 | Polypill post-MI: composite HR 0.76; CV death HR 0.67 | Complete abstract reviewed | 1 | DOI 10.1056/NEJMoa2208275[43] |
| Takii et al. (MIYAGI-AMI), Circ J 2010 | Incidence 7.4→27.0/100k; hospital death 20.0→7.8% | Complete abstract reviewed | 3 | DOI 10.1253/circj.CJ-09-0619; PMID 19942783[58] |
| Antithrombotic Trialists’ Collaboration, Lancet 2009[42] | Aspirin: secondary 19% event reduction; primary 12%, offset by bleeding | Abstract reviewed | 1 | ATT Collaboration |
| Bandosz et al., BMJ 2012 | [33] Poland 1991–2005: −54%; 54% risk factors, 37% treatment | Abstract reviewed | 4 | BMJ 2012;344:d8136 |
| Worcester Heart Attack Study | Hospital survival after initial AMI 81% (1975) → 91% (2005); age-adjusted in-hospital case fatality 22.2% (1975) → 15.1% (1984) | Abstract level | 3 | Floyd et al.[55]; Goldberg et al.[56] |
| Leon et al., Lancet 1997 and GBD | Post-Soviet CVD mortality surge of ~35–45% in the 1990s | Secondary/abstract level | 3 | PMID 9269215 |
| GBD 2023 CVD Collaborators, JACC 2025 | 19.2 million CVD deaths in 2023; risk-factor burden | Publisher record reviewed | 3 | DOI 10.1016/j.jacc.2025.08.015[24] |
Structured summaries where abstract-level evidence was used
England and Wales IMPACT — Unal, Critchley & Capewell. The IMPACT mortality model was applied to national treatment uptake, clinical effectiveness data, and population risk-factor trends from 1981–2000. CHD mortality declined 62% in men and 45% in women aged 25–84, corresponding to 68,230 fewer deaths in 2000. Treatment was assigned 42% and population risk-factor reduction 58%; smoking alone contributed 48%, with blood pressure and cholesterol about 9.5% each, and obesity, diabetes, and inactivity offsetting some gains. Abstract-level evidence; no numerical detail beyond the reported abstract was inferred.
Finland IMPACT — Laatikainen et al. Finnish national death, hospital, and social-insurance records were combined with random-sample risk-factor surveys and IMPACT treatment-effect estimates for 1982–1997. CHD mortality declined 63%. Treatment explained approximately 23%; risk-factor changes approximately 53–72%. Abstract-level evidence.
MONICA — Tunstall-Pedoe et al. The project standardized coronary-event ascertainment across 37 populations and assessed how changes in event rates and survival related to falling CHD mortality over approximately a decade. The central result, as summarized in the subsequent peer-reviewed literature, is that roughly two-thirds of the mortality decline arose through reduced coronary-event rates and one-third through improved case fatality, with substantial population and sex heterogeneity. Bibliographic/abstract record plus later peer-reviewed summary; no unsupported subgroup extraction was made.
MIYAGI-AMI Registry. Among 22,551 acute MI patients registered from 1979–2008, age-adjusted incidence increased from 7.4 to 27.0 per 100,000 while age-adjusted hospital mortality declined from 20.0% to 7.8%; ambulance use and primary PCI increased over the period. The abstract also reports 2008 mortality of 12.2% in women versus 6.3% in men. Complete abstract reviewed.
Evidence gaps and remaining uncertainty
No valid single decomposition exists for the entire period 1925–2026. IMPACT analyses typically compare two years 15–25 years apart and are concentrated in high-income countries after 1980. Extrapolating their percentages backward through the pre-CCU era, or forward into the PCSK9 and high-sensitivity troponin era, is unjustified.
Diagnostic drift is a first-order problem, not a footnote. A modern high-sensitivity troponin assay detects infarctions that would have gone entirely unrecognized decades ago, simultaneously inflating apparent incidence and deflating apparent case fatality. Framingham demonstrated the effect directly. Biomarker-adjusted or ECG-standardized surveillance therefore deserves substantially greater weight than unadjusted hospital discharge coding.
The boundaries between categories are causally porous. A statin lowers a population cholesterol measurement; antihypertensive prescribing lowers population mean blood pressure; physician counseling changes smoking; EMS enables earlier aspirin and PCI; troponin changes both diagnosis and treatment eligibility. Good IMPACT implementations adjust known overlaps, but residual double-counting remains possible.
The “unexplained” residual is not the health-system contribution. Better ambulance networks, catheterization laboratory availability, nursing, time-to-treatment, prevention clinics, and diagnostic recognition are partly embedded in observed treatment uptake and case-fatality change. The honest statement for that category is “not separately quantifiable from the current attribution literature.”
Averages conceal disparities. Slower decline in Black men; higher case fatality in women; persistent and in places widening socioeconomic and geographic gradients.
Sex-specific evidence is weaker than it should be. Women were under-represented in the foundational trials of the 1980s and 1990s; the proportional benefits of lipid and blood-pressure lowering appear consistent by sex, but data on presentation, diagnosis, and acute management in women remain less complete, and the outcome gap has not closed.
The epidemic is not over. Rising obesity and diabetes repeatedly subtract from the benefits of reduced smoking, cholesterol, and blood pressure in many major attribution models. Globally, cardiovascular disease is still ascending in much of the world.
Figures deliberately removed or constrained in this version. An unverifiable pooled cross-cohort attribution estimate has been deleted rather than retained with a caveat. The global cumulative “deaths prevented” figure is stated non-numerically. The claim of rising heart-attack mortality in adults under 55 has been replaced with the specific 2026 in-hospital STEMI finding.[59] Two quantities remain flagged: the population mean risk-factor shifts in Table 3 are order-of-magnitude summaries across differing populations and periods rather than values from a single sourced series, and the era bands in Table 5 are a schematic synthesis rather than a single dataset.
Key quantities that remain genuinely unknown: the effect size of very early, lifelong lipid lowering; whether Lp(a) lowering translates into event reduction; which patients benefit from anti-inflammatory therapy; and whether incretin therapies can be deployed at sufficient scale to substantially reduce the cardiometabolic counterweight.
Confidence grades for the main conclusions
High confidence. Coronary and acute-MI mortality have fallen extraordinarily — roughly 80–90% from late-twentieth-century U.S. reference levels — and both lower event incidence and lower case fatality contributed.
High confidence. Lowering LDL/ApoB, lowering blood pressure, stopping smoking, antiplatelet therapy in appropriate acute and secondary settings, and timely reperfusion causally reduce coronary events and/or death.
Moderate confidence. In the high-income populations best studied during the main 1970s–2000s decline, roughly one-half to two-thirds of the coronary mortality improvement arose from population risk-factor change and roughly one-quarter to two-fifths from treatment, with substantial country-specific departures.
Moderate confidence. Acute treatment itself typically explains only ~5–10% of the total historical CHD mortality decline in attribution models, even though acute care is responsible for a far larger share of improved survival among patients who actually have an infarction.
Moderate–high confidence. The direction of the international evidence is stable across the country-specific IMPACT analyses: risk factors somewhat ahead of treatment, with both large. No verified pooled point estimate is relied upon here.
Moderate–high confidence. Natural experiments in both directions — North Karelia and Poland downward, post-Soviet Russia upward — support a causal rather than merely associational reading of the population risk-factor contribution.
Moderate–high confidence. Progress has stalled since approximately 2011 in the U.S. and U.K., with stagnation in younger adults and recent evidence of worsening in-hospital mortality after first STEMI among adults aged 18–54,[59] and deteriorating hypertension control is a plausible contributor.
Low confidence. Any precise 1925–2026 partition into risk factors versus treatment; any exact cumulative century-long or global “lives saved” figure; any specific mortality estimate for a hypothetical modern population treated with literal 1950s medicine.
Central synthesis
- How much has CHD mortality declined? U.S. age-adjusted ischemic heart disease mortality fell 81% between 1970 and 2022, and AMI-coded mortality 89%; age-adjusted CHD mortality fell roughly 50% between 1980 and 2000 alone. Comparable declines of 47–84% are documented across high-income countries. Globally, age-standardized IHD mortality fell approximately 32% between 1990 and 2021 while absolute deaths rose.
- How much has MI incidence declined? Substantially, but with no valid universal figure and with major measurement caveats. Framingham ECG-defined first MI fell ~50% (1960–1999); Icelandic incidence fell 66% (1981–2006); ARIC found ~3–4% annual declines in most groups (1987–2008). Japan is the counterexample where incidence rose. Falling incidence was nonetheless the larger contributor during the classic MONICA era, averaging roughly two-thirds of the mortality decline.
- How much has MI case fatality declined? Dramatically. Pre-CCU hospital mortality of roughly 30% compares with contemporary in-hospital figures of ~3–7%. Framingham found age- and sex-adjusted case fatality at 30 days, one year, and five years each about 60% lower across 1960–1999.
- Of the fall in CHD mortality, what fraction is explained by each source? Approximately 45–70% population risk-factor improvement; approximately 15–40% preventive and chronic medical treatment; approximately 5–10% (up to ~12%) direct acute and emergency cardiac care; and a few percent to ~10% unexplained residual, which should not be interpreted as the health-system contribution. For the United States 1980–2000 specifically: 44% / 37% / 10% / 9%.
- Within risk-factor improvement, what were the contributions? Population total cholesterol approximately 10–45% (U.S. 24%) — historical models measured serum total cholesterol rather than ApoB; smoking approximately 9–48% (U.S. 12%, England/Wales 48%); blood pressure approximately 6–22% (U.S. 20%); physical activity and diet approximately 5–10% where separately modeled and not double-counted against cholesterol and blood pressure. Obesity and diabetes contributed negatively, offsetting the equivalent of roughly 8% and 10% of the U.S. decline respectively.
- The five advances that have probably prevented or postponed the most coronary (CHD) deaths. Note that the underlying attribution literature concerns coronary mortality specifically, not all cardiovascular mortality. This is inference from repeated attribution studies rather than a measured league table, and the ranking is order-of-magnitude rather than precise.
| Rank | Advance | Basis | Confidence |
| 1 | Reduced serum cholesterol exposure — food supply and diet first, lipid-lowering pharmacotherapy later | 24% of the U.S. decline, 32% Iceland, ~30% Ireland, dominant in Sweden; randomized LDL lowering causally reduces major vascular events ~20% per mmol/L | High |
| 2 | Smoking reduction and tobacco control | 12% (U.S.) to 48% (England/Wales); acts directly on first-event incidence | High |
| 3 | Blood-pressure reduction, from both population change and medication | 6–22% across models; ~10% fewer major CV events per 5 mmHg in randomized evidence | High |
| 4 | Comprehensive secondary prevention — antiplatelet therapy, lipid lowering, BP treatment, ACE inhibition, rehabilitation | 8–11% of entire national mortality declines despite applying only to those with established disease | Moderate–High |
| 5 | The acute coronary rescue system — CCU and defibrillation, aspirin and reperfusion, EMS and primary PCI | Smaller effect on incidence, transformative effect on case fatality; ~5–10% of total mortality decline, but a major reason short-term MI survival improved dramatically | Moderate–High |
Ranks 1 and 2 could reasonably be reversed in a population such as England and Wales where smoking dominated. The acute rescue system would rank first if the outcome of interest were survival after a heart attack rather than population coronary mortality.
The bottom line
People today are dramatically less likely to die of coronary heart disease than their grandparents for two fundamentally different reasons, and the failure to distinguish them is the source of nearly every misconception about this history.
First, they became less likely to have a heart attack at all. Smoking fell. Average blood pressure fell. Atherogenic cholesterol exposure fell. Food environments changed, tobacco policy changed, and, increasingly from the 1970s and 1990s, antihypertensive and lipid-lowering medicines pushed those biological risks lower still. In the international attribution literature, these changes generally explain more of the historical decline than acute cardiology does.
Second, when a heart attack does occur, medicine is vastly better at preventing it from being fatal. Coronary care units and defibrillation attacked malignant arrhythmia. Aspirin and antithrombotic therapy limited thrombosis. Thrombolysis and then primary PCI restored coronary flow. Emergency medical systems shortened delay. Secondary prevention lowered the probability of the next event.
The proposed summary — that the decline arose from fewer cardiovascular insults across the population, plus increasingly effective preventive medications, plus dramatic improvements in survival when heart attacks occurred — is therefore supported by the evidence, with three amendments:
- It is not a timeless 50/50 law. The balance shifts by country and, decisively, by era. Risk-factor change probably accounted for a larger share before 1980, because most modern therapy did not yet exist — but coronary care units, hypertension treatment, and CABG were already contributing, and a precise partition for that period is unavailable.
- Acute rescue deserves both more and less credit than it usually receives — more, because it is a major reason heart attacks are now far more survivable; less, because it explains only around 5–10% of the population-level mortality decline.
- The story does not end in triumph, and it is not a ratchet. The decline has stalled, and in adults under 55 in-hospital mortality after a first STEMI rose between 2011 and 2022.[59] Post-Soviet Russia demonstrated that a population can lose decades of cardiovascular progress in under ten years without losing any medical knowledge at all. Progress is contingent on social and behavioral conditions, not guaranteed by accumulated technology.
The fairest quantitative summary is this:
During the best-studied decades of the coronary mortality decline, favorable population risk-factor changes commonly explain about 45–70% of the fall, while medical and surgical treatment explains about 25–45%. Within the treatment contribution, direct acute-MI rescue commonly represents only around 5–10% of the total population mortality decline; the remainder comes largely from chronic treatment, secondary prevention, and management of established cardiovascular disease. Approximately two-thirds of the decline in coronary mortality during the classic MONICA era reflected fewer coronary events, and about one-third better survival after them.
In other words: modern cardiology has prevented an enormous number of deaths, but the century’s cardiovascular achievement is broader than cardiology alone. Population prevention reduced how often the coronary catastrophe happened; modern medicine transformed what happened next.
And the corollary matters more than the history. A large share of the twentieth century’s gains came from reducing population exposure to smoking, elevated blood pressure, and atherogenic cholesterol — alongside the transformation of acute care. Future gains are likely to depend increasingly on treating cumulative lifetime exposure rather than middle-aged thresholds, on addressing lipoprotein(a) and residual inflammatory risk, on countering the obesity and diabetes counterweight that has been eroding progress for thirty years — and, most of all, on the unglamorous work of actually delivering to patients the therapies that were proven to work decades ago.
References
Numbered in order of first appearance in the text.
- Herrick JB. Clinical features of sudden obstruction of the coronary arteries. 1912;59:2015–2020.
- King SJ, Wangdak Yuthok TY, Bacong AM, Khandelwal A, Kazi DS, Mussolino ME, Wong SS, Martin SS, Lewis EF, Rodriguez F, Palaniappan LP. Heart disease mortality in the United States, 1970 to 2022. J Am Heart Assoc. 2025;14(13):e038644. DOI 10.1161/JAHA.124.038644. PMID 40557798. (Adults aged 25 and older; National Vital Statistics System/CDC WONDER.)
- Ford ES, Ajani UA, Croft JB, et al. Explaining the decrease in U.S. deaths from coronary disease, 1980–2000. N Engl J Med. 2007;356:2388–2398. DOI 10.1056/NEJMsa053935. PMID 17554120.
- Unal B, Critchley JA, Capewell S. Explaining the decline in coronary heart disease mortality in England and Wales between 1981 and 2000. 2004;109:1101–1107. PMID 14993137.
- Laatikainen T, Critchley J, Vartiainen E, Salomaa V, Ketonen M, Capewell S. Explaining the decline in coronary heart disease mortality in Finland between 1982 and 1997. Am J Epidemiol. 2005;162:764–773. DOI 10.1093/aje/kwi274. PMID 16150890.
- Björck L, Rosengren A, Bennett K, Lappas G, Capewell S. Modelling the decreasing coronary heart disease mortality in Sweden between 1986 and 2002. Eur Heart J. 2009;30:1046–1056. DOI 10.1093/eurheartj/ehn554. PMID 19141562.
- Aspelund T, Gudnason V, Magnusdottir BT, et al. Analysing the large decline in coronary heart disease mortality in the Icelandic population aged 25–74 between 1981 and 2006. PLoS One. 2010;5:e13957. DOI 10.1371/journal.pone.0013957. PMID 21103050.
- Bennett K, Kabir Z, Unal B, et al. Explaining the recent decrease in coronary heart disease mortality rates in Ireland, 1985–2000. J Epidemiol Community Health. 2006;60:322–327. PMID 16537349.
- Tunstall-Pedoe H, Kuulasmaa K, Mähönen M, Tolonen H, Ruokokoski E, Amouyel P. Contribution of trends in survival and coronary-event rates to changes in coronary heart disease mortality: 10-year results from 37 WHO MONICA Project populations. 1999;353:1547–1557. DOI 10.1016/S0140-6736(99)04021-0. PMID 10334252.
- Björck L, Capewell S, O’Flaherty M, et al. Decline in coronary mortality in Sweden between 1986 and 2002: comparing contributions from primary and secondary prevention. PLoS One. 2015;10:e0124769. DOI 10.1371/journal.pone.0124769. PMID 25942424.
- Dawber TR, Meadors GF, Moore FE. Epidemiological approaches to heart disease: the Framingham Study. Am J Public Health. 1951;41:279–281. Keys A. Seven Countries: A Multivariate Analysis of Death and Coronary Heart Disease. Cambridge, MA: Harvard University Press; 1980.
- Julian DG. The history of coronary care units. Br Heart J. 1987;57:497–502; and Kouwenhoven WB, Jude JR, Knickerbocker GG. Closed-chest cardiac massage. 1960;173:1064–1067.
- Hu JS. The impact of coronary care unit on mortality from acute myocardial infarction in Hong Kong. A prospective randomized controlled study. Chin Med J (Engl). 1990;103(2):101–106. PMID 2118025.
- Killip T, Kimball JT. Treatment of myocardial infarction in a coronary care unit: a two year experience with 250 patients. Am J Cardiol. 1967;20:457–464. Mather HG, Pearson NG, Read KL, et al. Acute myocardial infarction: home and hospital treatment. Br Med J. 1971;3:334–338. Hill JD, Hampton JR, Mitchell JR. A randomised trial of home-versus-hospital management for patients with suspected myocardial infarction. 1978;1:837–841.
- Veterans Administration Cooperative Study Group on Antihypertensive Agents. Effects of treatment on morbidity in hypertension. 1967;202:1028–1034; and 1970;213:1143–1152.
- Havlik RJ, Feinleib M, eds. Proceedings of the Conference on the Decline in Coronary Heart Disease Mortality. NIH Publication No. 79-1610. Bethesda, MD: National Heart, Lung, and Blood Institute; 1979.
- Gruppo Italiano per lo Studio della Streptochinasi nell’Infarto Miocardico (GISSI). Effectiveness of intravenous thrombolytic treatment in acute myocardial infarction. 1986;1:397–402.
- ISIS-2 (Second International Study of Infarct Survival) Collaborative Group. Randomised trial of intravenous streptokinase, oral aspirin, both, or neither among 17,187 cases of suspected acute myocardial infarction. 1988;2:349–360. PMID 2899772.
- Yusuf S, Zucker D, Peduzzi P, et al. Effect of coronary artery bypass graft surgery on survival: overview of 10-year results from randomised trials by the Coronary Artery Bypass Graft Surgery Trialists Collaboration. 1994;344:563–570.
- Scandinavian Simvastatin Survival Study Group. Randomised trial of cholesterol lowering in 4444 patients with coronary heart disease (4S). 1994;344:1383–1389.
- Keeley EC, Boura JA, Grines CL. Primary angioplasty versus intravenous thrombolytic therapy for acute myocardial infarction: a quantitative review of 23 randomised trials. 2003;361:13–20. DOI 10.1016/S0140-6736(03)12113-7. PMID 12517460.
- Wilmot KA, O’Flaherty M, Capewell S, Ford ES, Vaccarino V. Coronary heart disease mortality declines in the United States from 1979 through 2011: evidence for stagnation in young adults, especially women. 2015;132:997–1002. PMID 26302759.
- American Heart Association. Heart Disease and Stroke Statistics — 2025 Update: A Report from the American Heart Association. 2025.
- GBD 2023 Cardiovascular Diseases Collaborators. Global, regional, and national burden of cardiovascular diseases and risk factors, 1990–2023. J Am Coll Cardiol. DOI 10.1016/j.jacc.2025.08.015.
- Muntner P, Hardy ST, Fine LJ, et al. Trends in blood pressure control among US adults with hypertension, 1999–2000 to 2017–2018. 2020;324:1190–1200.
- National Center for Health Statistics / Centers for Disease Control and Prevention. Decline in deaths from heart disease and stroke — United States, 1900–1999. MMWR Morb Mortal Wkly Rep. 1999;48:649–656.
- Thygesen K, Alpert JS, Jaffe AS, et al. Fourth Universal Definition of Myocardial Infarction (2018). 2018;138:e618–e651.
- Parikh NI, Gona P, Larson MG, et al. Long-term trends in myocardial infarction incidence and case fatality in the National Heart, Lung, and Blood Institute’s Framingham Heart Study. 2009;119:1203–1210. DOI 10.1161/CIRCULATIONAHA.108.825364. PMID 19237656.
- Rosamond WD, Chambless LE, Heiss G, et al. Twenty-two-year trends in incidence of myocardial infarction, coronary heart disease mortality, and case fatality in four US communities, 1987–2008. 2012;125:1848–1857. DOI 10.1161/CIRCULATIONAHA.111.047480. PMID 22420957.
- Myerson M, Coady S, Taylor H, Rosamond WD, Goff DC. Declining severity of myocardial infarction from 1987 to 2002: the Atherosclerosis Risk in Communities (ARIC) study. 2009;119:503–514.
- Cholesterol Treatment Trialists’ (CTT) Collaboration. Efficacy and safety of more intensive lowering of LDL cholesterol: a meta-analysis of data from 170,000 participants in 26 randomised trials. 2010;376:1670–1681.
- Ference BA, Ginsberg HN, Graham I, et al. Low-density lipoproteins cause atherosclerotic cardiovascular disease: evidence from genetic, epidemiologic, and clinical studies. A consensus statement from the European Atherosclerosis Society Consensus Panel. Eur Heart J. 2017;38:2459–2472.
- Bandosz P, O’Flaherty M, Drygas W, et al. Decline in mortality from coronary heart disease in Poland after socioeconomic transformation: modelling study. 2012;344:d8136. PMID 22279114.
- Koopman C, Vaartjes I, van Dis I, et al. Explaining the decline in coronary heart disease mortality in the Netherlands between 1997 and 2007. PLoS One. 2016;11:e0166139.
- Salonen JT, Puska P, Kottke TE, Tuomilehto J, Nissinen A. Decline in mortality from coronary heart disease in Finland from 1969 to 1979. Int J Epidemiol. 1989;18:595–601. DOI 10.1093/ije/18.3.595.
- Restrepo BJ, Rieger M. Denmark’s policy on artificial trans fat and cardiovascular disease. Am J Prev Med. 2016;50:69–76.
- Blood Pressure Lowering Treatment Trialists’ Collaboration. Pharmacological blood pressure lowering for primary and secondary prevention of cardiovascular disease across different levels of blood pressure: an individual participant-level data meta-analysis. 2021;397:1625–1636. DOI 10.1016/S0140-6736(21)00590-0. PMID 33933205.
- Cholesterol Treatment Trialists’ (CTT) Collaborators. The effects of lowering LDL cholesterol with statin therapy in people at low risk of vascular disease: meta-analysis of individual data from 27 randomised trials. 2012;380:581–590. DOI 10.1016/S0140-6736(12)60367-5. PMID 22607822.
- Cannon CP, Blazing MA, Giugliano RP, et al. Ezetimibe added to statin therapy after acute coronary syndromes (IMPROVE-IT). N Engl J Med. 2015;372:2387–2397. DOI 10.1056/NEJMoa1410489. PMID 26039521.
- Sabatine MS, Giugliano RP, Keech AC, et al. Evolocumab and clinical outcomes in patients with cardiovascular disease (FOURIER). N Engl J Med. 2017;376:1713–1722. PMID 28304224.
- Schwartz GG, Steg PG, Szarek M, et al. Alirocumab and cardiovascular outcomes after acute coronary syndrome (ODYSSEY OUTCOMES). N Engl J Med. 2018;379:2097–2107. DOI 10.1056/NEJMoa1801174. PMID 30403574.
- Antithrombotic Trialists’ (ATT) Collaboration. Aspirin in the primary and secondary prevention of vascular disease: collaborative meta-analysis of individual participant data from randomised trials. 2009;373:1849–1860.
- Castellano JM, Pocock SJ, Bhatt DL, et al. Polypill strategy in secondary cardiovascular prevention (SECURE). N Engl J Med. 2022;387:967–977. DOI 10.1056/NEJMoa2208275.
- Freemantle N, Cleland J, Young P, Mason J, Harrison J. Beta blockade after myocardial infarction: systematic review and meta regression analysis. 1999;318:1730–1737.
- Pfeffer MA, Braunwald E, Moyé LA, et al. Effect of captopril on mortality and morbidity in patients with left ventricular dysfunction after myocardial infarction (SAVE). N Engl J Med. 1992;327:669–677.
- SOLVD Investigators. Effect of enalapril on survival in patients with reduced left ventricular ejection fractions and congestive heart failure. N Engl J Med. 1991;325:293–302.
- Fibrinolytic Therapy Trialists’ (FTT) Collaborative Group. Indications for fibrinolytic therapy in suspected acute myocardial infarction: collaborative overview of early mortality and major morbidity results from all randomised trials of more than 1000 patients. 1994;343:311–322. PMID 7905143.
- Hallstrom AP, Ornato JP, Weisfeldt M, et al. Public-access defibrillation and survival after out-of-hospital cardiac arrest (PAD Trial). N Engl J Med. 2004;351:637–646. DOI 10.1056/NEJMoa040566.
- Maron DJ, Hochman JS, Reynolds HR, et al. Initial invasive or conservative strategy for stable coronary disease (ISCHEMIA). N Engl J Med. 2020;382:1395–1407. DOI 10.1056/NEJMoa1915922. PMID 32227755.
- Lincoff AM, Brown-Frandsen K, Colhoun HM, et al. Semaglutide and cardiovascular outcomes in obesity without diabetes (SELECT). N Engl J Med. 2023;389:2221–2232. DOI 10.1056/NEJMoa2307563.
- Tardif JC, Kouz S, Waters DD, et al. Efficacy and safety of low-dose colchicine after myocardial infarction (COLCOT). N Engl J Med. 2019;381:2497–2505.
- Nidorf SM, Fiolet ATL, Mosterd A, et al. Colchicine in patients with chronic coronary disease (LoDoCo2). N Engl J Med. 2020;383:1838–1847.
- Jolly SS, d’Entremont MA, Lee SF, et al. Colchicine in acute myocardial infarction (CLEAR SYNERGY / OASIS-9). N Engl J Med. 2025;392:633–642. DOI 10.1056/NEJMoa2405922.
- Tunstall-Pedoe H, Vanuzzo D, Hobbs M, et al. Estimation of contribution of changes in coronary care to improving survival, event rates, and coronary heart disease mortality across the WHO MONICA Project populations. 2000;355:688–700. PMID 10703800.
- Floyd KC, Yarzebski J, Spencer FA, Lessard D, Dalen JE, Alpert JS, Gore JM, Goldberg RJ. A 30-year perspective (1975–2005) into the changing landscape of patients hospitalized with initial acute myocardial infarction: Worcester Heart Attack Study. Circ Cardiovasc Qual Outcomes. 2009;2:88–95. DOI 10.1161/CIRCOUTCOMES.108.811828. PMID 20031820.
- Goldberg RJ, Gore JM, Alpert JS, Dalen JE. Incidence and case fatality rates of acute myocardial infarction (1975–1984): the Worcester Heart Attack Study. Am Heart J. 1988;115:761–767.
- Hochman JS, Sleeper LA, Webb JG, et al. Early revascularization in acute myocardial infarction complicated by cardiogenic shock (SHOCK). N Engl J Med. 1999;341:625–634.
- Takii T, Yasuda S, Takahashi J, et al. Trends in acute myocardial infarction incidence and mortality over 30 years in Japan: report from the MIYAGI-AMI Registry Study. Circ J. 2010;74:93–100. DOI 10.1253/circj.CJ-09-0619. PMID 19942783.
- Satish M, Walters RW, Wenzl FA, Safford M, Kini V. Sex differences in outcomes of young adults hospitalized with first myocardial infarction from 2011 to 2022. J Am Heart Assoc. 2026;15(5):e046517. DOI 10.1161/JAHA.125.046517. PMID 41744115. (National Inpatient Sample; 945,977 weighted first-AMI hospitalizations, ages 18–54.)
- Kitamura A, Sato S, Kiyama M, et al. Trends in the incidence of coronary heart disease and stroke in Japan: the Akita–Osaka study. J Am Coll Cardiol. 2008;52:71–79.
- Velazquez EJ, Lee KL, Jones RH, et al. Coronary-artery bypass surgery in patients with ischemic cardiomyopathy (STICH Extension Study). N Engl J Med. 2016;374:1511–1520.
- Farkouh ME, Domanski M, Sleeper LA, et al. Strategies for multivessel revascularization in patients with diabetes (FREEDOM). N Engl J Med. 2012;367:2375–2384.
- Boden WE, O’Rourke RA, Teo KK, et al. Optimal medical therapy with or without PCI for stable coronary disease (COURAGE). N Engl J Med. 2007;356:1503–1516.
- Al-Lamee R, Thompson D, Dehbi HM, et al. Percutaneous coronary intervention in stable angina (ORBITA): a double-blind, randomised controlled trial. 2018;391:31–40.
- Hochman JS, Anthopolos R, Reynolds HR, et al. Survival after invasive or conservative management of stable coronary disease (ISCHEMIA-EXTEND). 2023;147:8–19.
- Vartiainen E. The North Karelia Project: cardiovascular disease prevention in Finland. Glob Cardiol Sci Pract. 2018;2018(2):13. Vartiainen E, Laatikainen T, Peltonen M, et al. Thirty-five-year trends in cardiovascular risk factors in Finland. Int J Epidemiol. 2010;39:504–518.
- Salonen JT, Puska P, Mustaniemi H. Changes in morbidity and mortality during a comprehensive community programme to control cardiovascular diseases during 1972–77 in North Karelia. Br Med J. 1979;2:1178–1183. DOI 10.1136/bmj.2.6199.1178.
- Leon DA, Chenet L, Shkolnikov VM, et al. Huge variation in Russian mortality rates 1984–94: artefact, alcohol, or what? 1997;350:383–388. PMID 9269215.
- Fryar CD, Kit B, Carroll MD, Afful J. Hypertension prevalence, awareness, treatment, and control among adults age 18 and older: United States, August 2021–August 2023. NCHS Data Brief511. Hyattsville, MD: National Center for Health Statistics; October 2024.
- Tsimikas S, Karwatowska-Prokopczuk E, Gouni-Berthold I, et al. Lipoprotein(a) reduction in persons with cardiovascular disease (pelacarsen, phase 2). N Engl J Med. 2020;382:244–255.
- O’Donoghue ML, Rosenson RS, Gencer B, et al. Small interfering RNA to reduce lipoprotein(a) in cardiovascular disease (OCEAN[a]-DOSE, olpasiran). N Engl J Med. 2022;387:1855–1864.
- Nissen SE, Linnebjerg H, Shen X, et al. Lepodisiran, an extended-duration short interfering RNA targeting lipoprotein(a). 2023;330:2075–2083.
- Nicholls SJ, Nissen SE, Fleming C, et al. Muvalaplin, an oral small molecule inhibitor of lipoprotein(a) formation. 2023;330:1042–1053.
- Phase 3 cardiovascular outcome trials of Lp(a)-lowering therapy — Lp(a)HORIZON (NCT04023552), OCEAN(a)-Outcomes (NCT05581303), and ACCLAIM-Lp(a) (NCT06292013) — were registered as ongoing without reported outcome results as of August 2026.
- Kronenberg F, Mora S, Stroes ESG, et al. Lipoprotein(a) in atherosclerotic cardiovascular disease and aortic stenosis: a European Atherosclerosis Society consensus statement. Eur Heart J. 2022;43(39):3925–3946.
- Nissen SE, Lincoff AM, Brennan D, et al. Bempedoic acid and cardiovascular outcomes in statin-intolerant patients (CLEAR Outcomes). N Engl J Med. 2023;388:1353–1364.
- Roshandel G, Khoshnia M, Poustchi H, et al. Effectiveness of polypill for primary prevention of cardiovascular diseases (PolyIran): a pragmatic cluster-randomised trial. 2019;394:672–683.
- Yusuf S, Joseph P, Dans A, et al. Polypill with or without aspirin in persons without cardiovascular disease (TIPS-3). N Engl J Med. 2021;384:216–228.
- Ridker PM, Everett BM, Thuren T, et al. Antiinflammatory therapy with canakinumab for atherosclerotic disease (CANTOS). N Engl J Med. 2017;377:1119–1131.
- Greenland P, Blaha MJ, Budoff MJ, Erbel R, Watson KE. Coronary calcium score and cardiovascular risk. J Am Coll Cardiol. 2018;72:434–447.
- Nordestgaard BG, Chapman MJ, Humphries SE, et al. Familial hypercholesterolaemia is underdiagnosed and undertreated in the general population: consensus statement of the European Atherosclerosis Society. Eur Heart J. 2013;34:3478–3490.
- Neal B, Wu Y, Feng X, et al. Effect of salt substitution on cardiovascular events and death (SSaSS). N Engl J Med. 2021;385:1067–1077. DOI 10.1056/NEJMoa2105675.
- Kotseva K, De Backer G, De Bacquer D, et al. Lifestyle and impact on cardiovascular risk factor control in coronary patients across 27 countries: results from the European Society of Cardiology ESC-EORP EUROASPIRE V registry. Eur J Prev Cardiol. 2019;26(8):824–835.