La placa que nadie trató
Imagina a un paciente unos días después de una infarto cardíaco. El bloqueado arteria se ha abierto, un stent lo mantiene en su lugar y el dolor de pecho ha desaparecido. Es natural pensar que el problema se ha resuelto. Pero no es así. El stent trató un punto específico en una arteria. Repartidos por el resto del árbol coronario hay otros placas, la mayoría de ellos demasiado pequeños como para parecer preocupantes en un angiografía, y es ahí donde se producirán muchos de los próximos ataques cardíacos.
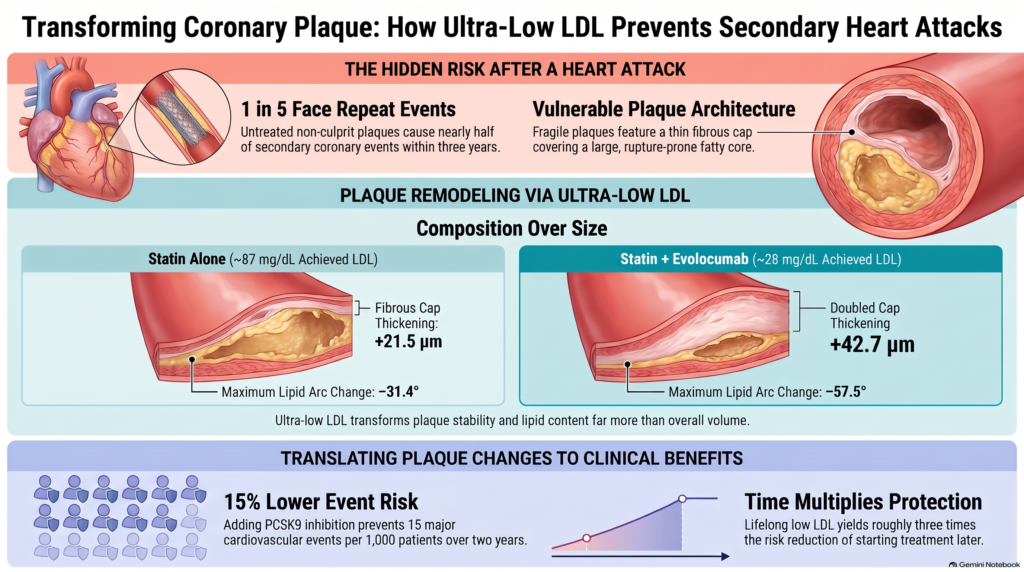
Eso no es una especulación. El Estudio PROSPECT se realizó un seguimiento de 697 pacientes durante tres años después de una síndrome coronario agudo. A lo largo de tres años, la tasa acumulada del indicador compuesto del estudio de eventos cardiovasculares adversos mayores fue de 20,41 TP9T, aproximadamente uno de cada cinco; se trataba de una combinación de muerte cardíaca, paro cardíaco, ataque cardíaco o reingreso hospitalario por inestabilidad o progresión de angina, no solo ataques cardíacos. Los eventos atribuidos a las lesiones originales se presentaron en el 12,9% de los pacientes, y los eventos atribuidos a placas no tratadas previamente, en el 11,6%; algunos pacientes presentaron ambos, por lo que la suma de ambos porcentajes no equivale al total, y no todos los eventos se debieron a una placa no tratada previamente. La mayoría de las placas no tratadas que posteriormente causaron problemas habían mostrado solo un estrechamiento leve en la angiografía original [8].
Así que la verdadera pregunta después de un ataque al corazón no es solo “¿Está funcionando el stent?”, sino “¿Podemos modificar el resto de la enfermedad antes de que provoque el próximo episodio?”. Este artículo analiza esa pregunta a la luz de la evidencia: ¿qué sucede dentro de la placa cuando colesterol LDL se reduce a niveles muy bajos; si eso se traduce en menos ataques cardíacos, qué nivel se considera lo suficientemente bajo y por qué el riesgo nunca llega a cero.
La respuesta breve. En estudios de imagen aleatorizados realizados tras eventos coronarios agudos, la reducción intensiva del colesterol LDL produjo mejoras sustanciales en determinados marcadores de vulnerabilidad de la placa, entre ellos el grosor de la capa y el contenido lipídico, con reducciones promedio relativamente modestas en volumen de placa. Varios ensayos aleatorios independientes sobre resultados demuestran que la reducción del colesterol LDL (LDL-C) se asocia con menos eventos cardiovasculares, pero no establecen que los cambios observados en las imágenes de la placa sean los que medien ese beneficio. La enfermedad coronaria no desaparece.
Véase la Figura 1 en la Parte 1.
Resumen de la evidencia
| Pregunta | Lo que muestra la evidencia | How sure are we? |
| ¿Un nivel muy bajo de colesterol LDL altera la placa? | Sí. Las capas se vuelven más gruesas, las señales lipídicas se reducen y el volumen de la placa disminuye ligeramente. | Demostrado en ensayos aleatorios de imágenes para medidas específicas de imágenes; no es un sustituto validado de los eventos |
| ¿Reducir el colesterol LDL previene los ataques cardíacos y golpes? | Sí. Los estudios a gran escala muestran una menor incidencia de ataques cardíacos, accidentes cerebrovasculares isquémicos, y procedimientos. | Demostrado en grandes ensayos aleatorios |
| ¿Reduce el número de muertes? | Sí, a favor de estatinas en ensayos agrupados; en el caso de los medicamentos de complemento, solo en análisis nominales o abiertos. | Eficacia comprobada para las estatinas; resultados sugerentes para los tratamientos complementarios |
| ¿Es mejor que el nivel sea aún más bajo, por debajo de 20 o incluso de 10 mg/dL? | Los niveles más bajos alcanzados se asociaron con un menor riesgo, lo cual concuerda con un beneficio, pero está sujeto a confusor y la imprecisión; no se detectó ninguna señal importante y consistente relacionada con la seguridad en las poblaciones y los períodos de seguimiento estudiados. | Indica (sin asignación aleatoria a esos niveles) |
| ¿Importa el tiempo? | Sí. Los beneficios aumentan con el paso de los años, y las personas que mantienen niveles bajos de colesterol LDL-C durante toda la vida presentan una incidencia mucho menor de enfermedad coronaria. | Con un fuerte respaldo |
| ¿Puede el riesgo llegar a cero? | No. Los eventos siguen ocurriendo incluso con niveles extremadamente bajos de colesterol LDL. | Coherente en todos los datos |
| ¿Son los cambios en la placa los que provocan la disminución de los eventos? | Es plausible, pero no está comprobado. | Inferencia |
Dentro de un ataque al corazón
Para entender qué Huygens A la hora de evaluarla, es útil saber cómo se ve una placa peligrosa.
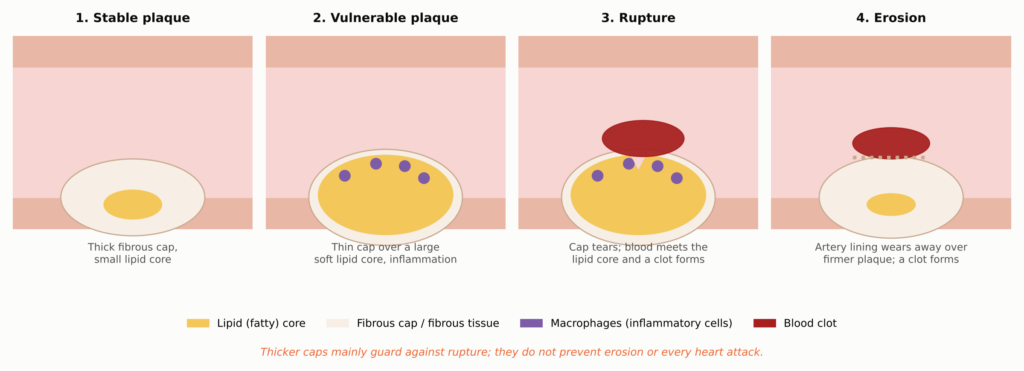
Véase la figura 2 de la parte 1.
Una placa es una acumulación dentro de la pared arterial, no un depósito adherido al interior de una tubería. Consta de varias partes:
- Ricos en lípidos o núcleo necrótico: un grupo de colesterol, cristales de colesterol, y restos de células muertas. Es blando, mecánicamente débil y favorece en gran medida la formación de coágulos si entra en contacto con la sangre.
- Capa fibrosa: una capa de colágeno, formada por células de músculo liso, que aísla el núcleo del torrente sanguíneo. En los estudios de autopsia de casos de muerte súbita coronaria, las capas rotas solían tener un grosor inferior a unos 65 micrómetros (μm), aproximadamente el ancho de un cabello humano fino [25].
- Macrófagos: células inmunitarias que absorben el colesterol y se convierten en “células espumosas.”. Liberan enzimas capaces de digerir el colágeno de la capa.
- Calcio: depósitos minerales. Las pequeñas acumulaciones dispersas de calcio en una placa activa pueden concentrar la tensión, mientras que las capas grandes y densas suelen indicar una enfermedad más antigua y fibrosa. El calcio extenso sigue siendo un marcador de carga de placa y riesgo.
La mayoría de los ataques cardíacos comienzan cuando una capa delgada se desgarra (se rompe) y la sangre entra en contacto con el núcleo que favorece la formación de coágulos. Una proporción menor comienza con erosión, en la que el revestimiento interno de la arteria se desgasta sobre una placa más firme y menos grasa [26]. Esa diferencia será importante más adelante, ya que el engrosamiento de una capa protectora sirve principalmente para evitar la ruptura.
Cómo llega el colesterol a la pared
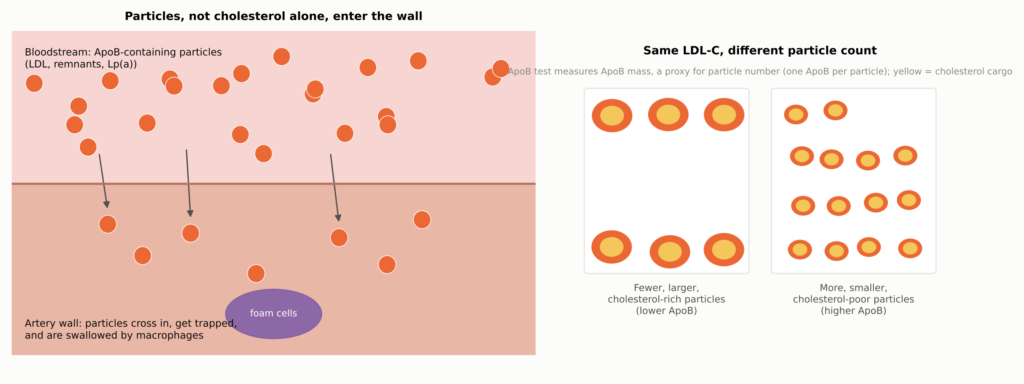
LDL El colesterol no se introduce en la pared arterial en forma de grasa suelta. Se transporta dentro de partículas, y son estas partículas las que atraviesan el revestimiento de la arteria, quedan atrapadas y son fagocitadas por los macrófagos. Cada una de estas partículas, ya sea LDL, un remanente rico en triglicéridos o Lp(a), transporta una molécula de un proteína llamado apolipoproteína B (ApoB): ApoB-100 en las partículas producidas por el hígado, y cuanto más corto ApoB-48 encendido quilomicrón restos del intestino.
See Figure 3 in Part 1.
In plain terms: ApoB is the traffic count; LDL-C is the cholesterol cargo. The standard lab value, LDL-C, measures how much cholesterol the LDL particles carry. The ApoB test measures ApoB mass concentration, which serves as a proxy for particle number because each major partícula aterogénica carries one ApoB-100 molecule; it does not literally count particles. Usually the two move together. When they disagree, as can happen with high triglicéridos, diabetes, obesidad, or small LDL particles, ApoB may better reflect how many particles can enter the artery wall.
For readers who use international units, these are the approximate conversions at the LDL-C levels discussed in this article (rounded; for example, 40 mg/dL is about 1.03 mmol/L, so the rounded values are not exactly equivalent thresholds):
| LDL-C (mg/dL) | 70 | 55 | 40 | 30 | 20 | 10 |
| LDL-C (mmol/L) | 1.8 | 1.4 | 1.0 | 0.78 | 0.52 | 0.26 |
Looking Inside a Living Artery
For most of the history of cardiology, nobody could see a fibrous cap in a living person. Angiograms show only the silhouette of the open channel. That changed with catheters that image the artery from the inside.
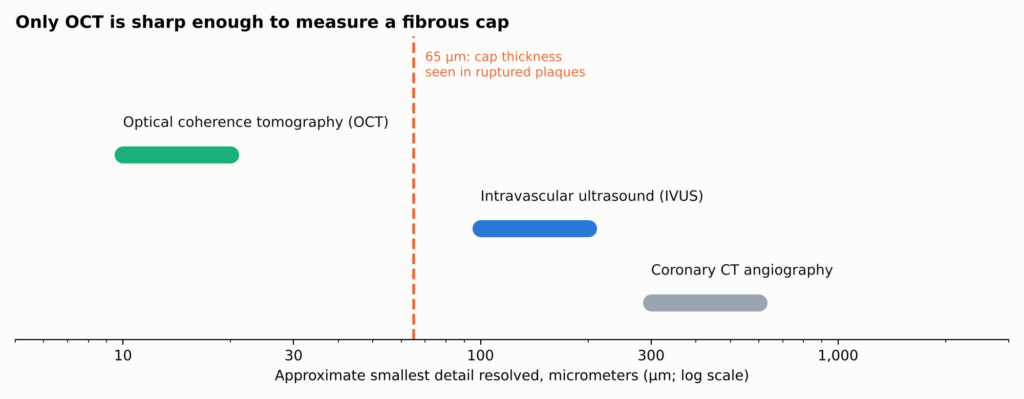
Figura 10. Approximate resolution of imágenes coronarias methods (typical ranges; vary by system). Only OCT resolves detail finer than a vulnerable fibrous cap, so cap-thickness results come from OCT, while plaque volume comes from IVUS, which sees through the full wall. Near-infrared spectroscopy (NIRS, not shown) detects the chemical signature of lipid rather than structure. None of these is a microscope: tissue labels are inferences.
| Imaging tool | What it is good at | What it cannot do well |
| OCT (light) | Measures cap thickness, arco lipídico, macrophage-like signals, calcium, clot | Cannot see total plaque volume behind lipid |
| IVUS (ultrasound) | Measures plaque volume and how the artery has remodeled | Too coarse to measure a cap |
| NIRS (spectroscopy) | Detects the chemical signature of lipid | Cannot measure caps or volume on its own |
| Coronary CT | Shows plaque across the whole heart without a catheter | Cannot see caps or fine detail |
None of these is a microscope. The tissue labels they produce are inferences from how light or sound behaves. An OCT increase in cap thickness, a NIRS decrease in lipid, and an IVUS decrease in plaque volume are complementary findings, not interchangeable ones.
The HUYGENS Experiment
HUYGENS (High-Resolution Assessment of Coronary Plaques in a Global Evolocumab Randomized Study) was built to answer one question: if LDL cholesterol is pushed very low right after a heart attack, do the dangerous-looking plaques elsewhere in the heart change? It was a phase 3, multicenter, randomized, double-blind, placebo-controlled imaging trial [9, 1]. Amgen, which makes evolocumab, funded it, and several investigators reported financial ties to the company [9].
Who Took Part
The investigators deliberately chose people whose remaining plaques already looked vulnerable. Patients had a non-ST-elevation heart attack (NSTEMI) treated with angiography and a procedure on the culprit artery. They needed LDL-C above a threshold that depended on their statin use (at least 130 mg/dL on no statin, 80 mg/dL on a low- or moderate-intensity statin, or 60 mg/dL on a estatina de alta intensidad), and a separate, untreated artery segment at least 40 mm long showing placa rica en lípidos on OCT: a cap no thicker than 120 μm and a lipid arc greater than 90 degrees [9].
Everyone took a maximally tolerated statin. Half were also randomized to evolocumab 420 mg, an injected inhibidor de PCSK9, and half to a placebo injection, monthly through week 48, with repeat OCT and IVUS at about week 50 to 52 [9]. HUYGENS included 161 randomized and treated patients (80 evolocumab, 81 placebo). Of the treated patients, 135 had evaluable imaging at follow-up, and a smaller subset had paired IVUS, The registry results report the OCT endpoints for the full analysis set of all 161 treated patients, of whom 119 had paired OCT measurements of the primary endpoint, so the analysis did not directly reimage all 161; the IVUS results come from a smaller subset [1]. Participants averaged 60.5 years of age, and 28.6% were women.
How Low LDL Went
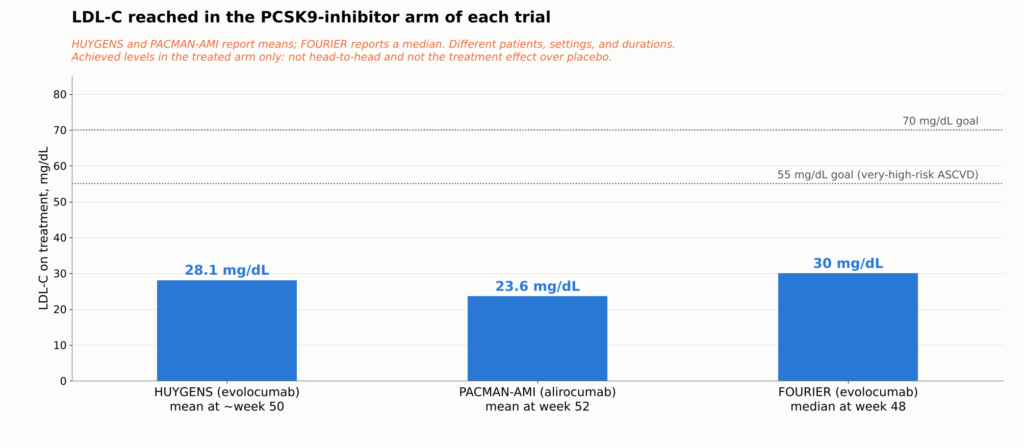
Mean LDL-C at enrollment was 141.3 mg/dL. At follow-up it was 28.1 mg/dL with evolocumab versus 87.2 mg/dL with placebo [1]. The placebo group was not untreated: many patients entered on no statin or a low dose, so their fall from about 141 to 87 mg/dL largely reflects starting or strengthening a statin. Every HUYGENS comparison is statin versus statin plus evolocumab.
What Happened to the Plaque
See Figure 4 in Part 1.
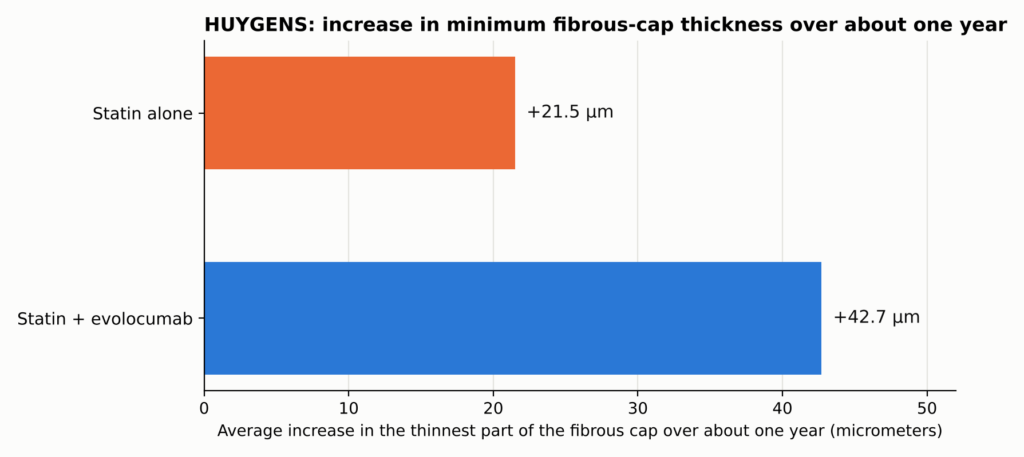
The protective cap thickened by an average of +42.7 μm with evolocumab versus +21.5 μm with placebo, least-squares means from the trial’s analysis of covariance in all 161 treated patients (the full analysis set, per the trial’s registry results); a difference of 21.2 μm (95% CI 4.7–37.7; P=0.015) [1]. The lipid arc shrank more (−57.5 versus −31.4 degrees), and the macrophage signal fell more. Plaque volume, measured by IVUS in an exploratory subset, changed only modestly: volumen percentual de ateroma change −2.29 versus −0.61 percentage points, an arithmetic difference of −1.68 points (not an adjusted contrast, and not directly comparable with PACMAN-AMI’s model-based estimate).
In plain terms. The average increase in cap thickness was about twice as large with evolocumab. That compares the size of the increases, not the caps themselves, and it does not mean heart-attack risk was halved. The big change was in what the plaque is made of, not in how large it is. These results describe the selected nonculprit segments that were imaged, not every plaque in the coronary tree.
A secondary review by trial investigators also reported fewer evolocumab-treated patients with very thin caps (below 65 μm) after treatment [27]. The full HUYGENS results table is in the Technical Appendix.
Two later HUYGENS analyses looked for patients who responded differently. Patients with high Lp(a) showed a larger difference in cap thickening between evolocumab and placebo [28], and patients who reached lower ApoB levels had more favorable plaque findings than those who did not [29]. Both are small, post hoc subgroup analyses: they were not randomized to those levels, they need replication, and they do not establish an independent treatment target or mechanism. Details are in the Technical Appendix.
What HUYGENS Cannot Tell Us
HUYGENS provides randomized evidence that adding evolocumab to statin therapy after NSTEMI improves several OCT-derived features associated with plaque vulnerability in selected nonculprit coronary lesiones. It does not establish that these imaging changes directly prevented later cardiovascular events.
Huygens was not designed to show fewer heart attacks, strokes, or deaths. That would take tens of thousands of patients, not 161. It imaged only at the start and at one year, so it cannot say how quickly caps change. It studied people chosen because their plaques already looked vulnerable. And it cannot show that thicker caps caused any later drop in events. For that, we need other kinds of trials.
Not a One-Off: Other Trials Saw the Same Thing
A single 161-patient trial would be easy to dismiss. HUYGENS is persuasive because other trials, using different drugs and different imaging tools, saw the same pattern.
PACMAN-AMI randomized 300 heart attack patients a alirocumab, another PCSK9 antibody, or placebo, both on top of rosuvastatina, starting within 24 hours after urgent PCI for the heart attack, and assessed nonculprit plaques with complementary imaging methods. Among the 300 randomized participants, paired IVUS was available in 265; the NIRS lipid analysis included 263 patients, and the OCT cap-thickness analysis 221 patients (105 alirocumab, 116 placebo) who had a fibroateroma at both time points. All three measurements came from the same randomized trial. LDL-C fell to 23.6 mg/dL versus 74.4 mg/dL. Three complementary imaging modalities, measured in overlapping patients within the same trial, showed concordant favorable changes: percent ateroma volume fell more (difference −1.21 percentage points), the NIRS lipid signal fell more (difference −41.24), and cap thickness rose more (+62.67 versus +33.19 μm; difference +29.65 μm) [7]. These differences are the trial’s model-based estimates. When light, sound, and chemistry agree within one trial, the finding is more convincing than any single measure, though it is still one trial.
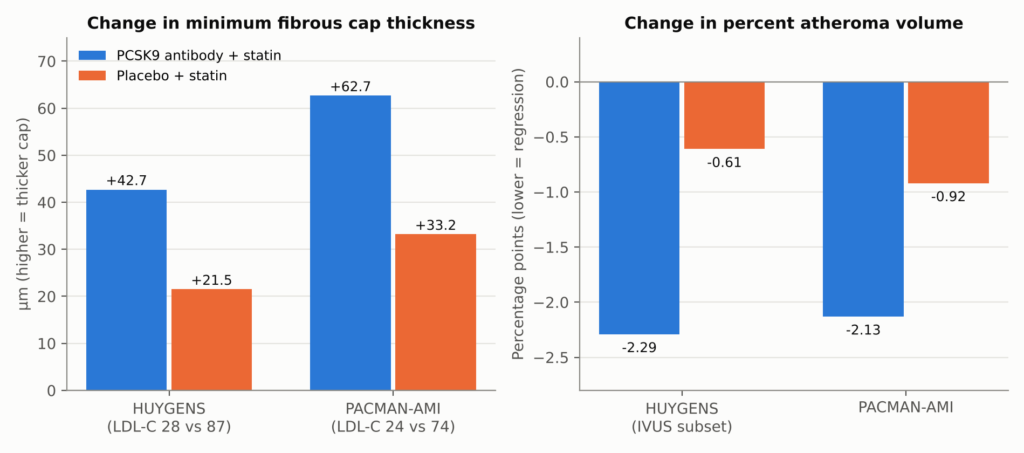
Figure 11. HUYGENS and PACMAN-AMI: change over about one year in each treatment arm. Both trials added a PCSK9 antibody (evolocumab in HUYGENS, alirocumab in PACMAN-AMI) to statin therapy after infarto de miocardio. Bars are within-arm mean changes as reported; the between-group differences were +21.2 μm (P=0.015) and +29.65 μm (11.75–47.55) for cap thickness, and −1.68 (arithmetic) and −1.21 (−1.78 to −0.65) percentage points for percent atheroma volume. For PACMAN-AMI, simple subtraction of the arm means gives 29.48 μm, slightly different from the trial’s model-adjusted 29.65 μm because the trial’s mixed-effects model accounts for repeated measurements and for the multiple arteries imaged in each patient; the text uses the adjusted figure. The two panels use different units and should not be compared with each other. HUYGENS percent atheroma volume was an exploratory endpoint in an IVUS subset. Analysis populations differ by measure: HUYGENS cap results are model estimates in the full analysis set of 161 treated patients (119 with paired OCT; 135 with any evaluable follow-up imaging) and its PAV comes from a smaller IVUS subset; PACMAN-AMI’s PAV comes from 265 patients with paired IVUS and its cap thickness from 221 patients with a fibroatheroma at both time points. Sources: [1, 7].
GLAGOV randomized 968 patients (846 with evaluable follow-up IVUS) with stable coronary disease to evolocumab or placebo for 76 weeks, with the main IVUS scan at week 78. LDL-C averaged 36.6 versus 93.0 mg/dL. Percent atheroma volume changed by −0.95 percentage points with evolocumab versus +0.05 with placebo (between-group difference −1.0 percentage point; 95% CI −1.8 to −0.64, reproduced verbatim from the published trial), and 64% versus 47% of patients had measurable regression [30]. These are within-arm changes plus the trial’s reported between-group contrast, not percent reductions in plaque mass. In an exploratory subgroup that reached about 24 mg/dL, 81% regressed. GLAGOV also shows the limits: about a third of treated patients did not regress, and a tissue-analysis substudy found no significant differences in plaque components [31].
Earlier statin and ezetimiba trials told the same story at higher LDL-C levels: lower LDL-C meant less plaque growth or modest regression [32, 33, 34, 35], and thicker caps on OCT [36]. YELLOW III documented favorable within-person changes in plaque-imaging measurements over 26 weeks; because it was uncontrolled, it cannot establish how much of the change was due to evolocumab [37]. A 2025 single-arm evolocumab CT/PET study reported less placa no calcificada and lower microcalcificación activity, while placa calcificada volume rose; its imaging endpoints measure different things and should be read individually [38]. Not every trial was positive: Odisea J-IVUS found no significant difference in its plaque endpoint over 36 weeks [39].
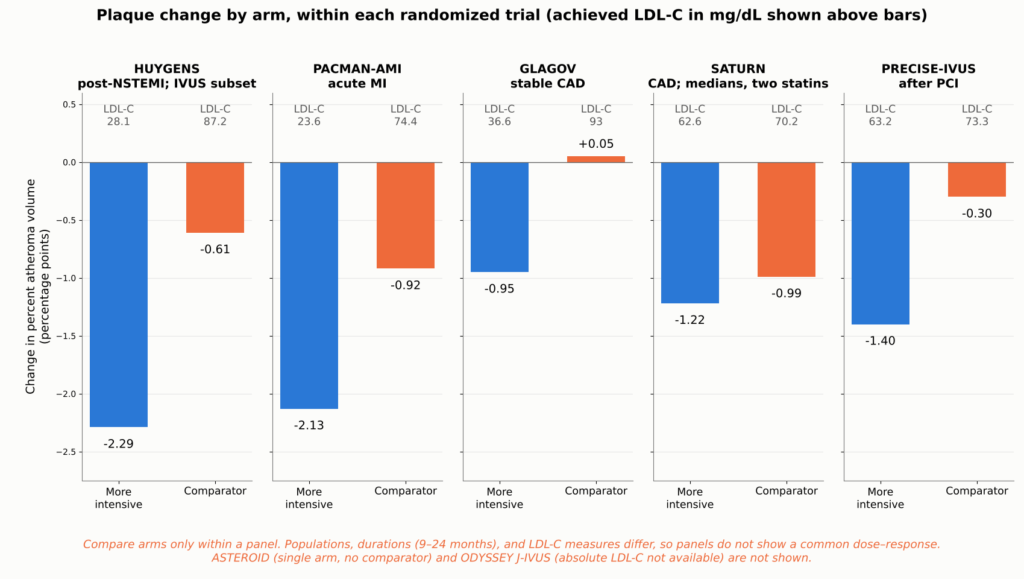
Figure 12. Change in IVUS percent atheroma volume in each arm of five randomized imaging trials, one panel per trial, with each arm’s achieved LDL-C. Compare arms only within a panel: populations, durations (9 to 24 months), and LDL-C measures (GLAGOV is time-weighted) differ, so the panels are not evidence of a common dose–response relationship. HUYGENS values come from an exploratory IVUS subset. Saturno reported median changes and time-weighted LDL-C, whereas the other trials report means. ASTEROIDE is omitted because it had no comparator arm, and ODYSSEY J-IVUS because absolute achieved LDL-C was not available in the sources reviewed. Sources: [34, 35, 30, 1, 7].
What does a one-point drop in plaque volume mean? Percent atheroma volume (PAV) is the share of the vessel’s area taken up by plaque. A change from 40% to 39% is a one-percentage-point drop. It does not mean 1% of all plaque disappeared, and it does not mean a narrowing opened by the same amount.
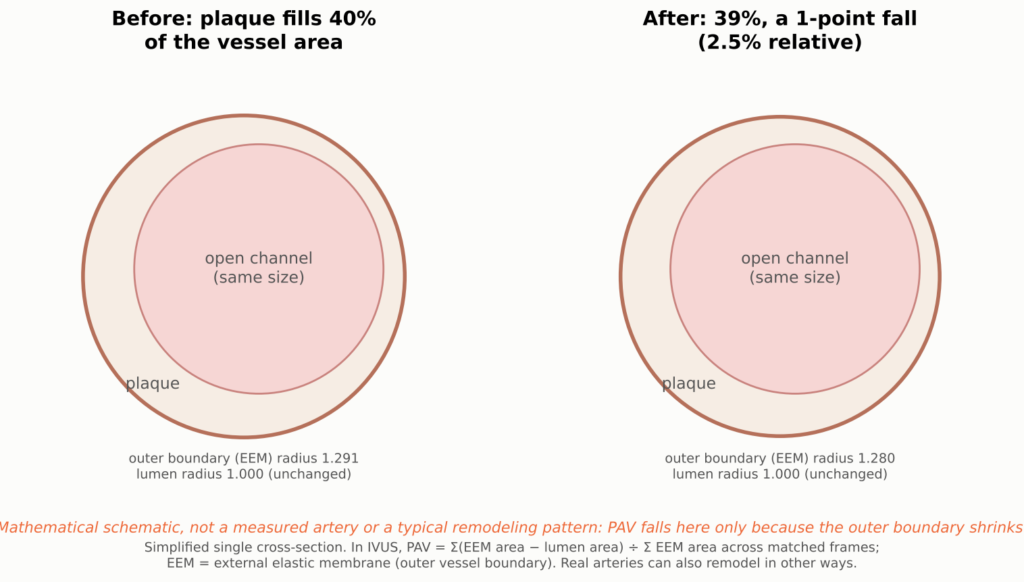
Figure 13. Conceptual illustration of the scale of a one-percentage-point change in percent atheroma volume (PAV); the open channel (lumen) is drawn the same size in both panels, and the outer vessel boundary shrinks slightly. PAV is the share of the vessel’s area occupied by plaque, averaged along a segment. A fall from 40% to 39% is the scale of change in the IVUS trials. It is not 1% of all plaque disappearing, and it does not mean the open channel widened by a matching amount, because arteries also remodel.
A side-by-side table of all the imaging trials is in the Technical Appendix.
Different, Not Much Smaller
If plaque volume barely changes, how could a plaque become less likely to rupture? Mechanics offers a plausible answer. Rupture happens when stress concentrates in a thin cap stretched over a soft core. Less lipid and a thicker cap should lower that stress even if the plaque is almost the same size. That offers a plausible explanation for how outcome trials can show meaningful reductions in events while imaging trials show only small changes in volume, though it remains an interpretation, not a demonstrated cause.
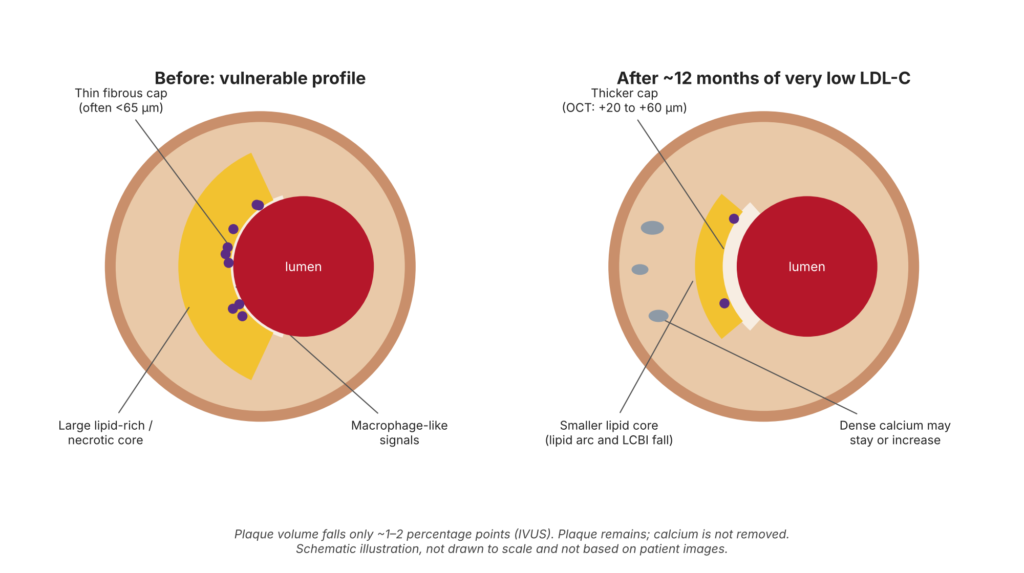
Figure 14. Illustrative schematic—not an observed patient or a guaranteed treatment response. Conceptual diagram of estabilización de la placa: not drawn to scale and not derived from patient images. Randomized imaging trials show cap thickening, less lipid, fewer macrophage-like signals, and a small decrease in plaque volume. Calcium changes and lesion anatomy are illustrative, not measured transitions in a single plaque. Randomized trials do not show plaque elimination, calcium removal, or routine lumen enlargement.
The chain of reasoning from lower LDL-C to fewer heart attacks has several links. Some are measured directly; others are inferred.
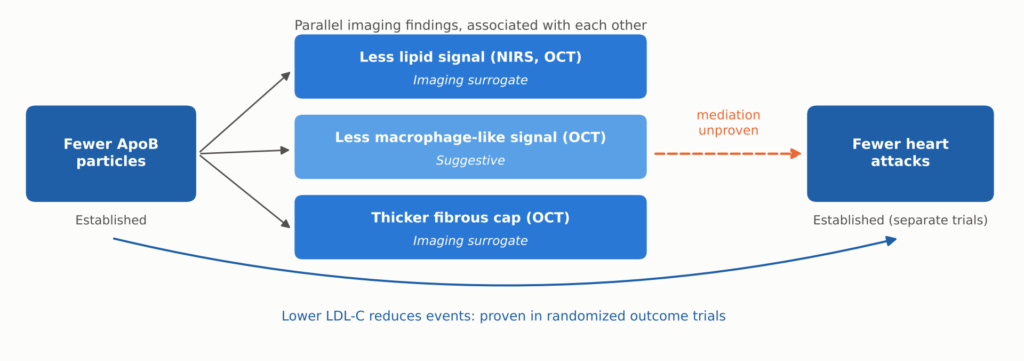
Figure 15. How lower LDL-C relates to plaque imaging and to clinical events. Fewer ApoB particles and fewer events are both established, the second in large outcome trials. Lipid, macrophage-like, and cap findings are parallel imaging surrogates measured together, not a proven sequence. Whether these imaging changes mediate the reduction in events has not been established.
Observational imaging supports the idea that these features matter. In the CLIMA study, untreated plaques that combined four high-risk OCT features carried a several-fold higher one-year risk of events [40]. Linking a feature to risk, however, is not the same as proving that changing the feature lowers risk.
Three cautions keep this in proportion:
- A thicker cap is not a guarantee. The 65 μm cutoff comes from autopsy studies [25]. Thicker caps can still rupture, OCT measurement of such thin structures varies, and cap thickness varies along its length.
- Erosion is different. Heart attacks from erosion are driven more by injury to the artery lining and inflamación than by cap thinning [26]. Cap thickening mostly addresses rupture, which is one reason events still occur at very low LDL-C.
- Calcium may go up, not down. High-intensity statins increased IVUS calcium measures while reducing plaque volume [41], and statin users in the PARADIGM CT cohort had slower growth of noncalcified plaque but faster growth of calcified plaque [42]. A rising puntaje de calcio on treatment does not, by itself, mean treatment has failed, and serial calcium scores are not a validated way to judge treatment. Claims that LDL lowering “dissolves calcium” are not supported.
Nor does regression necessarily reopen the artery. A reduction in percent atheroma volume does not necessarily translate into a comparable increase in lumen diameter. Coronary arteries can remodel outward or inward, and regresión de la placa may occur without a clinically meaningful change in the narrowing seen on an angiogram. The imaging trials discussed here do not establish routine reversal of fixed coronary narrowing.
From Better-Looking Plaque to Fewer Heart Attacks
Imaging trials show what happens to plaque. Outcome trials, which enroll thousands of patients and count actual heart attacks, strokes, and deaths, show whether it matters. This is the strongest evidence in the story.
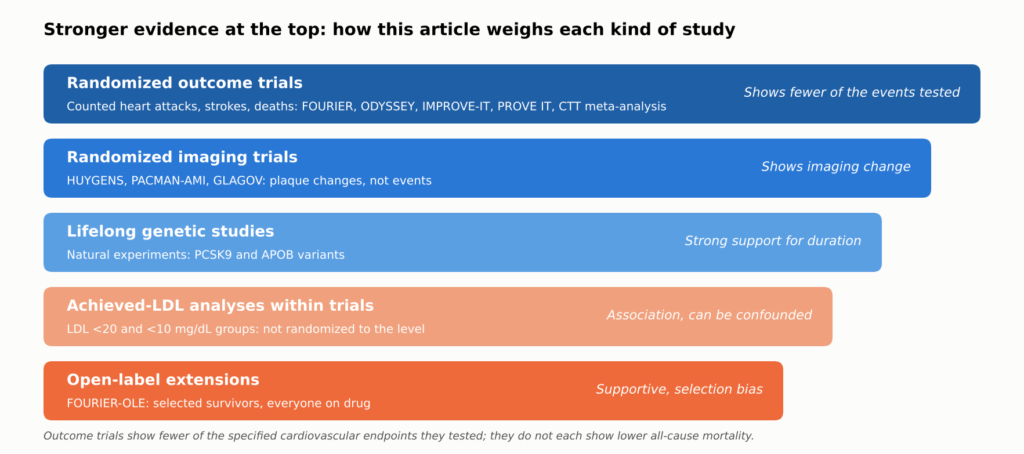
Figure 16. How the evidence in this article is weighted. Randomized outcome trials establish that lowering LDL-C prevents the events they tested; randomized imaging trials show that it changes imaging measures of plaque; the remaining tiers support, but cannot by themselves prove, claims about very low targets, long-term legacy, and lifelong benefit. Each claim in the text is labeled by the kind of evidence behind it.
The Numbers That Matter to Patients
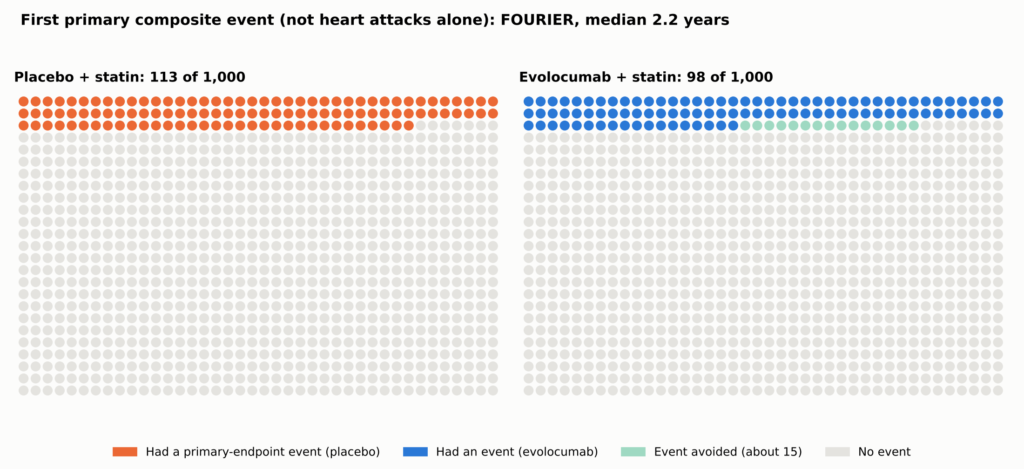
Relative reductions sound large; absolute reductions show what a person gains. In Fourier, the primary composite (cardiovascular death, heart attack, stroke, hospitalization for angina inestable, o coronaria revascularización) occurred in 9.8% with evolocumab versus 11.3% with placebo over a median 2.2 years: a 15% relative hazard reduction and an absolute difference of about 1.5 percentage points, or about 15 fewer people per 1,000 [2]. That composite is not the chance of a heart attack alone, and the original Estudio FOURIER did not establish a reduction in death.
See Figure 5 in Part 1.
| Prueba | What was tested | Seguimiento | Event rate, treatment vs control | Difference per 1,000 (people; FOURIER-OLE: events per 1,000 person-years) |
| MIRACL [43] | High-dose statin vs placebo, started in hospital | 16 weeks | 14.8% vs 17.4% | About 26 |
| PROVE IT–TIMI 22 [10] | Intensive vs moderate statin | 2 años | 22.4% vs 26.3% | About 39 |
| IMPROVE-IT [4] | Adding ezetimibe to a statin | 7 years | 32.7% vs 34.7% | About 20 |
| RESULTADOS DE ODYSSEY [3] | Adding alirocumab after ACS | Median 2.8 years | 9.5% vs 11.1% | About 16 |
| FOURIER [2] | Adding evolocumab, stable disease | Median 2.2 years | 9.8% vs 11.3% | About 15 |
| FOURIER-OLE [14] (open-label extension; not a randomized trial endpoint) | Earlier vs later evolocumab (open label) | Median 5 more years | CV death, MI, or stroke 2.05 vs 2.58 per 100 person-years | About 5.3 fewer events per 1,000 person-years (rate difference, not people) |
Each trial counted its own combination of events in its own population over its own follow-up, so the rows are not a ranking. FOURIER-OLE compares original randomized assignment in selected survivors, all on open-label evolocumab. A detailed version of this table, with relative effects, LDL-C levels, and mortality, is in the Technical Appendix.
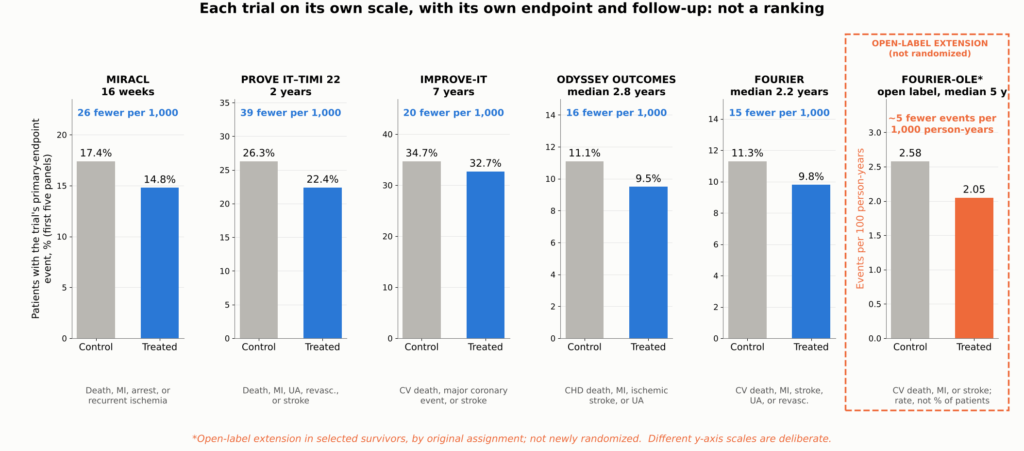
Figure 17. Absolute benefit in the major outcome trials, shown as small multiples: each panel gives one trial’s control and treated primary-endpoint event rates on its own y-axis scale, with the difference expressed per 1,000 patients treated. Each trial used a different punto de terminación compuesto, population, comparator, and follow-up period, so the panels cannot be compared with one another or read as a ranking; they show the scale of benefit within each trial. *FOURIER-OLE shows cardiovascular death, MI, or stroke during the open-label extension, comparing patients originally assigned evolocumab with those originally assigned placebo (2.58 vs 2.05 events per 100 person-years); because this is a rate, not a percentage of patients, its panel has its own y-axis label; it is an exploratory comparison in selected survivors, not a new randomized trial. Sources: [43, 10, 4, 3, 2, 14].
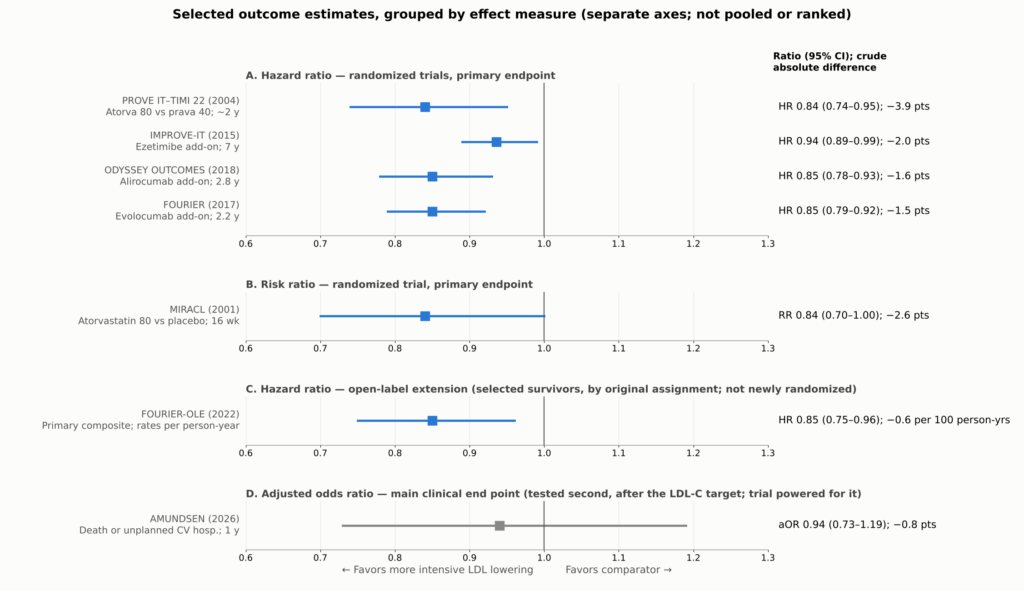
Figure 18. Selected outcome estimates from the trials discussed: primary endpoints for the randomized trials, the open-label extension comparison for FOURIER-OLE, and the main clinical end point for AMUNDSEN. Each trial used a different composite endpoint, population, and follow-up, and reported a different effect measure (risk ratio, cociente de riesgos instantáneos, or adjusted odds ratio), so each effect measure is shown in its own panel with its own axis, for orientation, not pooled or ranked. Absolute differences are crude differences in each trial’s reported event rates over its own follow-up (for FOURIER-OLE, per 100 person-years). FOURIER-OLE is not a newly randomized outcome comparison: it compares selected surviving participants by original assignment during an open-label extension in which all received evolocumab. AMUNDSEN (gray) is shown for its main clinical end point, which was tested second in the trial’s prespecified hierarchy, after the LDL-C target endpoint; the trial was powered for it. PROVE IT–TIMI 22’s interval is derived from its reported 16% (5%–26%) relative reduction. MIRACL’s riesgo relativo is shown as the trial reported it, estimated from a Cox proportional hazards model. Sources: [43, 10, 4, 3, 2, 14, 24].
Fewer Heart Attacks and Strokes; Death Is Harder to Move
The benefit is concentrated in nonfatal events. In FOURIER, heart attacks fell from 4.6% to 3.4%, strokes from 1.9% to 1.5%, and coronary procedures from 7.0% to 5.5% [2]. ODYSSEY OUTCOMES and IMPROVE-IT showed similar reductions in heart attack and ischemic stroke [3, 4]. These are secondary analyses that support the main findings.
Among the add-on trials (IMPROVE-IT, ODYSSEY OUTCOMES, and FOURIER), none showed a reduction in death that was statistically significant under its prespecified rules. ODYSSEY OUTCOMES’ lower all-cause death rate was nominal only. This does not prove that there is no mortality benefit; it means one should not be claimed as proven for these drugs individually.
Counting Every Event
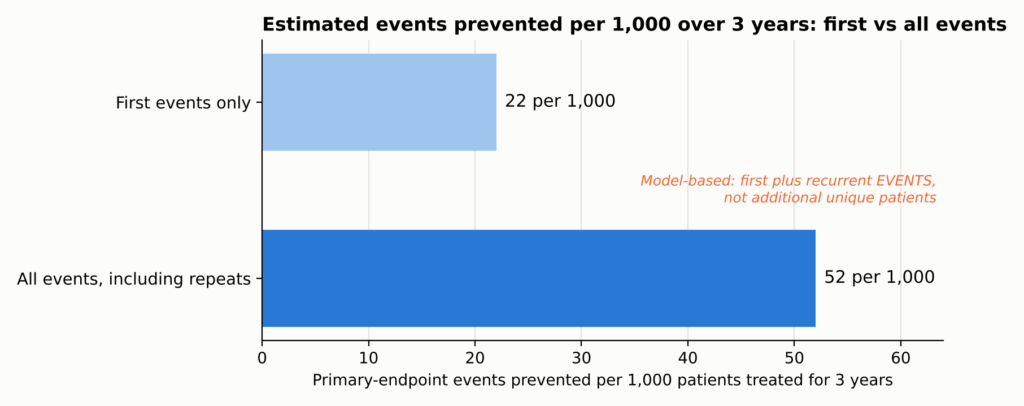
Trials usually count only each patient’s first event. But a patient who has one heart attack often has another, or a stroke, or a stent. When FOURIER counted every event, the estimated number of events prevented more than doubled, although the relative risk reduction did not: about 22 first events but 52 total events prevented per 1,000 patients treated for three years, counting first and repeat events rather than additional people helped (total events: rate ratio 0.82, 95% CI 0.75–0.90; first events: hazard ratio 0.85) [11].
See Figure 6 in Part 1.
The Big Picture
The Cholesterol Treatment Trialists pooled individual data from 26 statin trials and about 170,000 people. Each 38.7 mg/dL (1 mmol/L) reduction in LDL-C lowered major vascular events by about 22%, and all-cause death fell by about 10% per mmol/L, with no increase in cancer or other non-cardiovascular deaths [12]. A meta-regression of randomized trials found broadly similar proportional risk reductions per unit of LDL-C lowering across statins, ezetimibe, and PCSK9 inhibitors, which act through LDL-receptor pathways [13]. That supports a common LDL-mediated mechanism, though it does not mean every drug has identical clinical effects or safety profiles.
In plain terms. The absolute LDL-C reduction and how long it lasts are major determinants of benefit, but therapies differ in evidence, timing, off-target effects, and tolerability.
Do the plaque changes explain this benefit? Plausibly, in part. The same drugs at similar LDL-C levels improve plaque in imaging trials and reduce events in outcome trials. But the imaging and outcome trials enrolled different people, and no trial has shown that the imaging changes account for the event reduction. The plaque findings make the benefit biologically coherent; the outcome trials establish the benefit for the endpoints they tested.
Time Is the Hidden Ingredient
Perhaps the most important lesson in the newer data is that benefit builds over time.
The Lag Effect
In FOURIER, the relative reduction in cardiovascular death, heart attack, or stroke was about 16% in the first year and about 25% after the first year [2]. Earlier statin trials showed the same pattern: benefit grows the longer treatment continues. That is consistent with, though it does not prove, plaque gradually becoming more stable.
The Legacy Effect
FOURIER did not demonstrate a significant cardiovascular mortality benefit during its median 2.2-year randomized phase. Afterward, 6,635 surviving participants who chose to continue entered an open-label extension, FOURIER-OLE, in which everyone received evolocumab; median extension follow-up was 5.0 years, and maximum evolocumab exposure across the parent trial and extension reached about 8.4 years; median LDL-C during the extension was about 30 mg/dL [14].
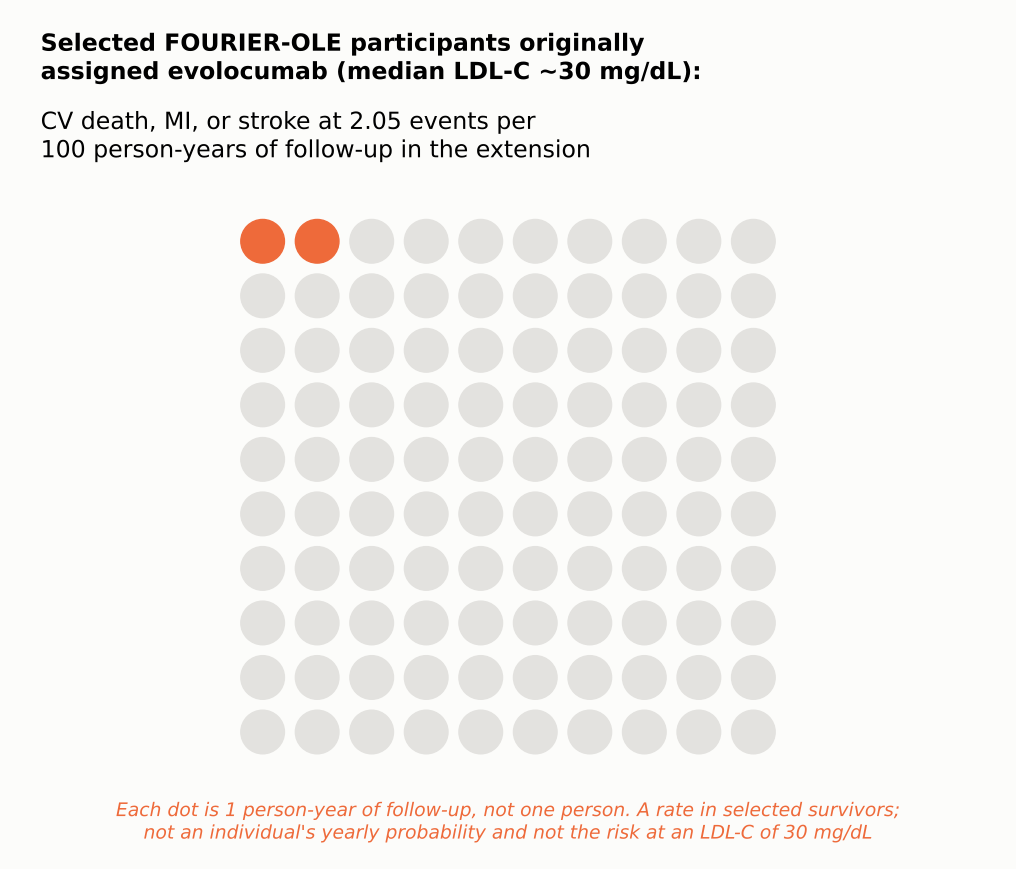
Even though both groups were now on the same drug at similar LDL-C, those originally assigned evolocumab, about two years earlier, had fewer subsequent events. Cardiovascular death, heart attack, or stroke occurred at 2.05 versus 2.58 events per 100 person-years (HR 0.80; 95% CI 0.68–0.93), and cardiovascular death at 0.68 versus 0.90 per 100 person-years (HR 0.77; 95% CI 0.60–0.99), as reported in the results table of the primary FOURIER-OLE publication, where events were counted during extension follow-up by original randomized assignment [14]. This is an exploratory comparison among selected survivors in open-label follow-up, not a new blinded randomized trial, so it cannot establish a mortality benefit by itself. It is compatible with a legacy effect from earlier, longer LDL lowering, but selection into the extension and open-label treatment mean it cannot show that early treatment caused the difference, or what carried it forward.
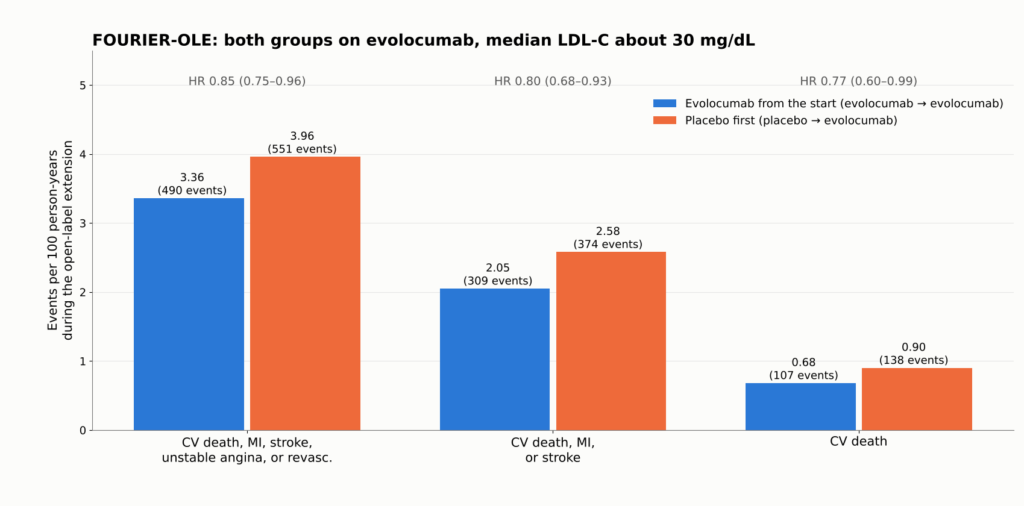
Figure 19. FOURIER-OLE: event rates per 100 person-years during the open-label extension, when all 6,635 participants received evolocumab and median LDL-C was about 30 mg/dL. Patients first randomized to evolocumab had 2.2 more years of low LDL-C exposure. Even in that group, cardiovascular death, MI, or stroke occurred at about 2 per 100 person-years. Extension participants were selected survivors and treatment was open label. Source: [14]. These are event rates in a selected-survivor, open-label extension; they cannot prove a randomized mortality benefit.
How Fast Things Change
- LDL-C falls within days with a PCSK9 antibody and within two to four weeks with a statin. In AMUNDSEN, median LDL-C was 16 mg/dL six weeks after evolocumab was started before stenting, versus 56 mg/dL with standard care [24].
- Placa changes in the randomized imaging trials were measured after roughly 9 to 24 months. YELLOW III documented within-person changes at 26 weeks, but it was uncontrolled, so it cannot establish the size of the drug’s effect or how early it began [37]. A trial that imaged only at the start and at one year cannot show that caps began thickening within days.
- Clinical events: MIRACL showed fewer recurrent ischemic events within 16 weeks [43]; FOURIER’s curves separated within about six months [2]; FOURIER-OLE’s exploratory cardiovascular-death difference emerged only during the open-label extension [14].
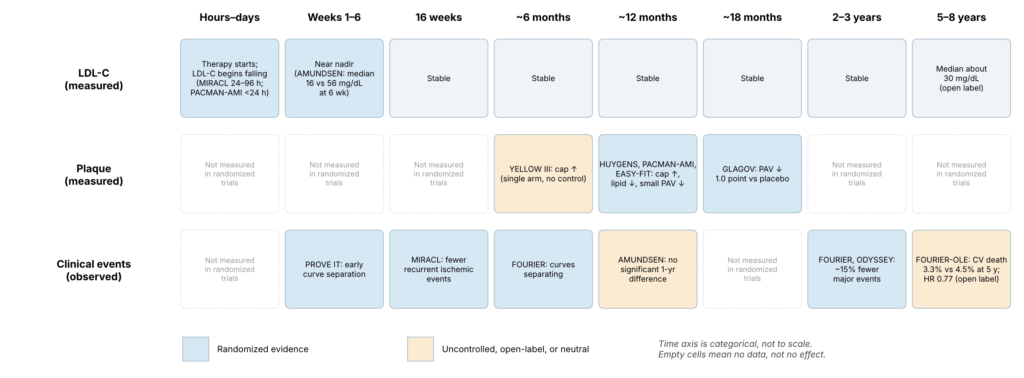
Figure 20. Timeline separating measured LDL-C changes, measured plaque changes, and observed clinical benefit. Each cell shows when a study made a measurement, not when a biological effect began; the figure cannot show when stabilization started, and no unmeasured time points are extrapolated. The time of a study measurement is not necessarily the time a biological benefit began; clinical benefit can begin before imaging is repeated, and no fixed biological lag is implied. A blank cell means not measured, not no effect.
Exposure Over a Lifetime
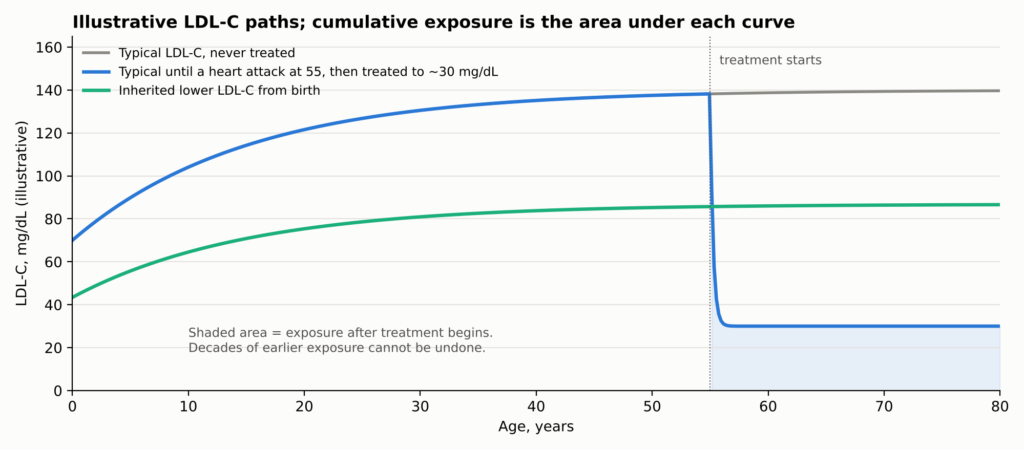
Why should time matter so much? Because ateroesclerosis reflects the total, accumulated exposure of the artery wall to ApoB particles over a lifetime. Genetic studies indicate that exposición acumulativa drives risk [44]. A person treated after a heart attack lowers their future exposure but carries decades of past exposure and the plaque it built.
See Figure 7 in Part 1.
How much a patient gains depends on three things together: baseline risk, how much LDL-C falls, and how long it stays down. The same LDL reduction prevents far more events in a high-risk patient, and larger sustained reductions prevent more.
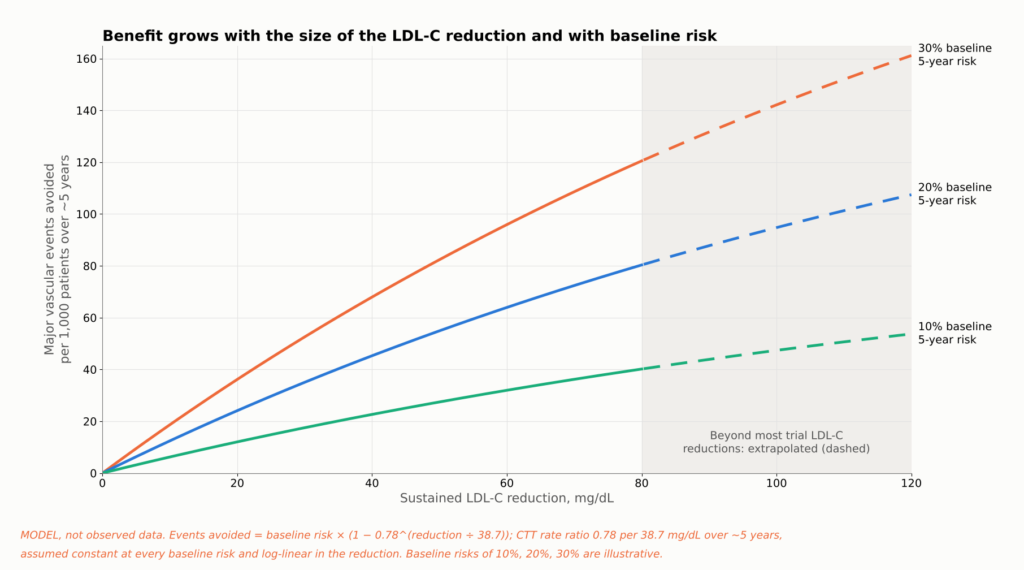
Figure 21. Evidence summary, not a patient-specific prediction. Lines apply the Cholesterol Treatment Trialists’ estimate of a 22% lower risk of major vascular events per 38.7 mg/dL (1 mmol/L) of LDL-C lowering over about five years [12] to three illustrative baseline five-year risks. The same LDL-C reduction prevents more events in higher-risk patients, and larger sustained reductions prevent more. Longer duration adds further benefit beyond what a five-year estimate shows (see the lifetime-exposure figure). Reductions above about 80 mg/dL extend beyond much of the trial data. Assumptions: the CTT rate ratio (a relative risk from a metaanálisis, not a trial hazard ratio) is applied uniformly at every baseline risk and scales log-linearly with LDL-C reduction. This is not a patient calculadora de riesgo.
How Low Should LDL Go?
Patients often ask whether 40 is good enough, or whether 20 or 10 is better. The honest answer depends on what kind of evidence you accept, because the lower one goes, the more the evidence shifts from randomized comparisons to observational ones.
| LDL-C level | What the evidence looks like | En pocas palabras |
| Below 70 mg/dL | Randomized trials (PROVE IT, statin imaging trials) | Established for drug regimens that reached these levels (not randomized to the threshold) |
| Below 55 mg/dL | Randomized trials (IMPROVE-IT, ODYSSEY, FOURIER) | Established for drug regimens that reached these levels (not randomized to the threshold) |
| Below 40 mg/dL | Randomized trial arms reached it (FOURIER about 30; GLAGOV 36.6) | Con un fuerte respaldo |
| Below 30 mg/dL | Imaging trials (HUYGENS 28, PACMAN-AMI 24); achieved-level analyses | Supported for plaque; outcomes observational |
| Below 20 mg/dL | Thousands of patients in FOURIER and FOURIER-OLE reached it, but were not randomized to it | Lower risk, no clear safety signal; observational |
| Below 10 mg/dL | Small subsets of FOURIER, FOURIER-OLE, and ODYSSEY | Consistent but statistically fragile |
No trial cited here randomized post-heart-attack patients between specific LDL-C targets below 55 mg/dL. People in the drug trials were randomized to drugs, not to “20 versus 40.” That is the most important caveat in this area.
Within those limits, the data point one way. In FOURIER, 2,669 participants reached LDL-C below 20 mg/dL (0.5 mmol/L) by week 4; lower achieved LDL-C was associated with steadily lower cardiovascular risk across the range studied, and serious adverse events were not related to achieved LDL-C over the randomized period [17]. In FOURIER-OLE, about 1,604 participants maintained LDL-C below 20 mg/dL; lower levels remained associated with lower risk and no detected increase in serious adverse events over the extension’s follow-up [18]. In ODYSSEY OUTCOMES, patients who transiently reached below 15 mg/dL had fewer subsequent events in an adjusted post hoc comparison (HR 0.72; 95% CI 0.51–0.997), which does not establish that aiming below 15 mg/dL is better [45].
In plain terms. Lower achieved LDL-C has generally been linked to lower event rates across the ranges examined, including very low levels. The studies reviewed have not identified a clear lower threshold; evidence becomes sparse at extreme LDL-C, and achieved-level analyses cannot identify the best target. No randomized trial has shown that aiming for 10 or 20 mg/dL beats aiming for 30 or 40 mg/dL.
How Low Can Risk Go?
There is a different question hiding inside “how low should LDL go.” Suppose LDL-C is pushed nearly to zero. How low can the rate of heart attack, stroke, and cardiovascular death fall? The answer differs sharply between people who already have coronary disease and people who have had low LDL-C since birth.
In People Who Already Have Atherosclerosis
This is not a randomized comparison of LDL-C targets: patients sorted themselves into achieved-LDL groups, so selection and confounding can only partly be adjusted for, and the analysis does not prove there is no biological floor. Within that limit, the peer-reviewed FOURIER-OLE achieved-LDL analysis found risk falling steadily down to the lowest levels studied, below 20 mg/dL [18].
Two points follow. Risk was lowest at the lowest achieved levels studied, an observational association. And the floor is well above zero: among selected participants entering FOURIER-OLE, cardiovascular death, heart attack, or stroke occurred at 2.05 events per 100 person-years of follow-up in those originally assigned evolocumab, the group treated longest; this is a rate by original randomized assignment, not the risk at an LDL-C of 30 mg/dL [14].
These are observational comparisons within trials; patients who reach the lowest levels may differ in ways that statistical adjustment cannot fully remove.
Why the Floor Exists
- Plaque already built. These patients carried decades of accumulated plaque, and IVUS shows plaque burden falling by only a few percentage points.
- Short exposure. Two to eight years of very low LDL-C cannot erase forty or more years of higher exposure.
- Other pathways. Lp(a), triglyceride-rich remnants, and residual inflammation persist. In CANTOS, COLCOT, and LoDoCo2, anti-inflammatory therapy reduced events in patients already on lipid-lowering drugs [19, 20, 46].
- Other causes. Some strokes come from the heart or tiny vessels, and some heart attacks from erosion, artery tears, or clots carried from elsewhere. Fumar, presión arterial, diabetes, and enfermedad renal also continue to drive risk.
Nature’s Experiment: People Born With Low LDL
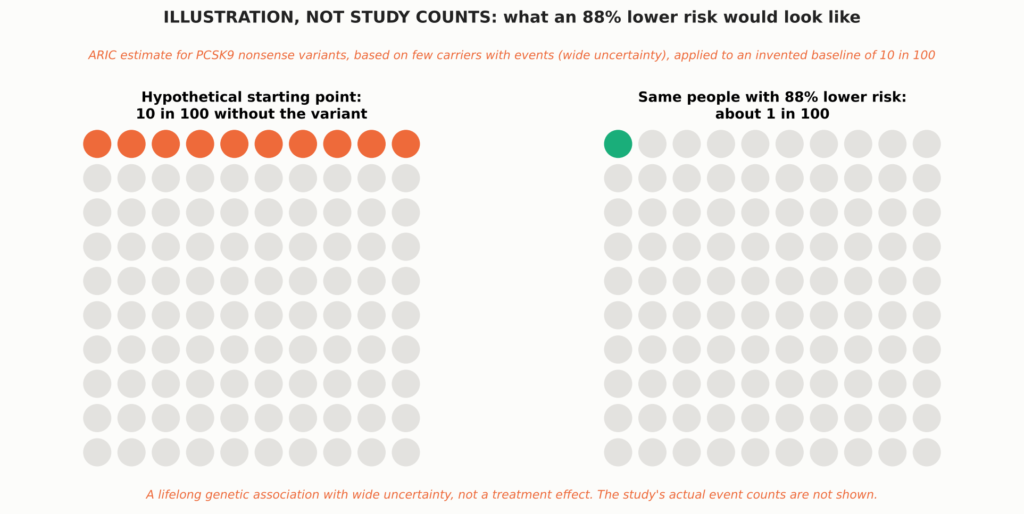
Some people inherit variantes genéticas that lower LDL-C from birth. Because those variants are assigned at conception, largely independent of lifestyle, they act like natural randomized experiments. Their results are dramatic.
See Figure 8 in Part 1.
- PCSK9 nonsense variants. En el ARIC study, Black participants carrying inactivating PCSK9 variants had about 28% lower LDL-C and an 88% lower risk of enfermedad coronaria over 15 years. White participants with a milder variant had about 15% lower LDL-C and 47% lower risk [5]. Few carriers had events, so the estimate is imprecise (hazard ratio 0.11; 95% CI 0.02–0.81).
- APOB truncating variants. Carriers had 43 mg/dL lower LDL-C and 72% lower odds of early coronary disease [47].
- PCSK9 R46L in large studies. This common variant lowers LDL-C only modestly, yet it was associated with less coronary or cardiopatía isquémica [48, 15] and lower cardiovascular mortality [16].
- Across nine variants in six genes (312,321 people), each 38.7 mg/dL of lifelong lower LDL-C was associated with 5% lower coronary risk, about three times the effect per unit of statins started later in life; this is an illustrative comparison across different study designs, not causal equivalence [6].
The genetic data also mark limits. The same R46L variant that lowered coronary risk was not associated with lower ischemic stroke [15], and lifelong lower LDL-C from PCSK9 variants was associated with lower cardiovascular but not mortalidad por todas las causas [16]. Across these datasets, reductions in ischemic stroke or all-cause mortality were not consistently demonstrated; estimates differ by variant, population, endpoint, and statistical precision. These are observational genetic associations with population-specific uncertainty. Effect sizes differ across variants, populations, and endpoints, and because they reflect lifelong exposure, their scale cannot be equated with a drug treatment effect started in adulthood; quantitative comparisons with trials are illustrative.
People who inherit two inactivating PCSK9 variants are extremely rare. The best-documented case is a 32-year-old woman with no detectable PCSK9 and LDL-C of 14 mg/dL who was healthy, fertile, and working as an aerobics instructor [49]. She was described at a single point in time; nobody knows her long-term cardiovascular outcome.
Putting the Two Together
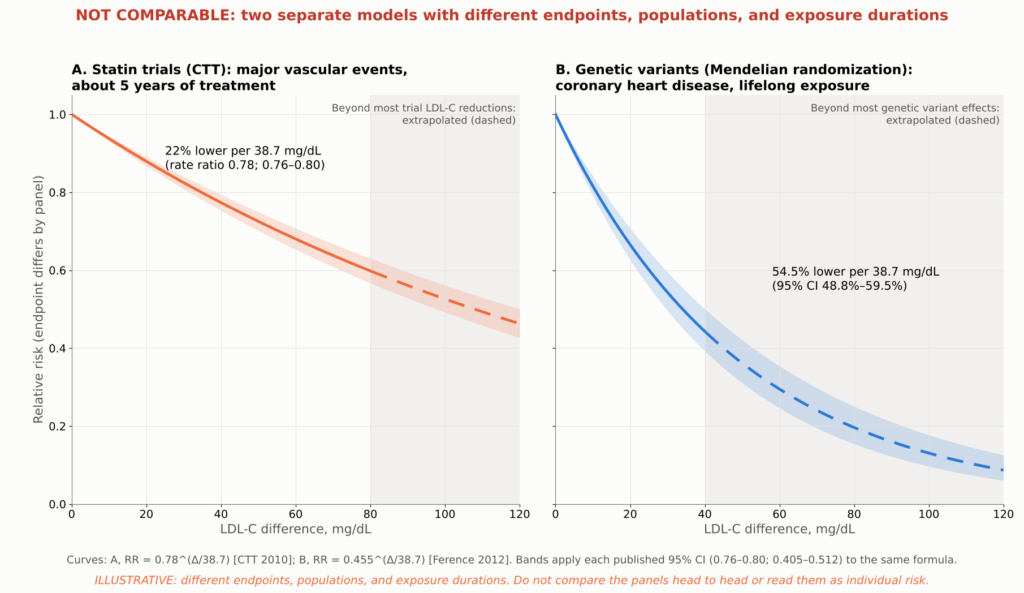
Figure 22. Illustrative model, not trial data or a patient risk calculator. Lines show two published log-linear associations with different endpoints, populations, and exposure durations: the Cholesterol Treatment Trialists’ rate ratio of 0.78 (95% CI 0.76–0.80) for major vascular events per 38.7 mg/dL over about five years of statin treatment [12], and the Aleatorización mendeliana estimate of 54.5% (95% CI 48.8%–59.5%) lower coronary heart disease risk per 38.7 mg/dL of lifelong exposure, from 312,321 participants and 9 variants in 6 genes [6]. Each curve is ratio^(LDL-C difference/38.7); shaded bands carry each published 95% intervalo de confianza through the same formula and are not observed trial confidence bands. Extrapolated segments are dashed: in panel B beyond about 40 mg/dL, past the range of most genetic variants, and in panel A beyond about 80 mg/dL, past most trial LDL-C reductions, and the model assumes the relación log-lineal holds at extreme exposures, which has not been shown. The two estimates are shown in separate panels, without individual study or trial points, because their endpoints and populations differ; they must not be read as a head-to-head comparison of statin therapy with lifelong genetic LDL reduction or as a prediction of individual lifetime risk.
The figure compares two published estimates. Applied to a difference of about 75 mg/dL, the statin-trial estimate predicts roughly 38% fewer major vascular events over about five years, while the genetic estimate predicts roughly 78% fewer coronary events over a lifetime. Both are extrapolations, especially the genetic one. They illustrate why duration matters, not what any individual should expect.
The defensible conclusion. Early, sustained, very low exposure to ApoB particles probably drives atherosclerotic coronary events toward a low floor. But no human data show near-zero cardiovascular events, the genetic data suggest stroke and total mortality would remain above zero, and in people who already have coronary disease, events still occur even at extremely low LDL-C.
Is Very Low LDL Safe?
A natural worry is that the body needs cholesterol. It does, but cells make their own, and the evidence so far is reassuring, with honest limits.
- Memory and thinking. In EBBINGHAUS, 1,204 FOURIER patients underwent formal cognitive testing over a median 19 months, with no difference between evolocumab and placebo and no link to achieved LDL-C [21]. Longer follow-up found no excess of reported cognitive events [18], though that relies on adverse-event reports.
- Bleeding strokes. Dosis alta atorvastatina after stroke modestly increased derrame cerebral hemorrágico in SPARCL [50]. FOURIER, ODYSSEY OUTCOMES, and the very-low-LDL analyses showed no significant excess [2, 17, 18], though such strokes are uncommon.
- Statins modestly raise the risk of new diabetes, about 9% in relative terms, mostly in people already near the threshold [22]. PCSK9 inhibitors and very low LDL-C have not shown a comparable increase [2, 17].
- The adrenal glands and gonads can make their own cholesterol and also take it up from circulating lipoproteínas, and large PCSK9 programs have not shown a clinically important hormonal signal.
Achieved-LDL analyses are observational within trials and subject to selection and confundimiento residual; any isolated nominal findings are hypothesis-generating, and very long-term safety at extreme levels remains incompletely characterized.
Drug side effects are a separate matter: PCSK9 antibodies cause slightly more injection-site reactions (2.1% vs 1.6% in FOURIER) [2], and statins can cause muscle symptoms, though true muscle injury is rare. Randomized safety data for PCSK9 antibodies cover about two to three years; open-label exposure reached about 8.4 years [14]. In selected FOURIER extension participants, very low achieved LDL-C was not associated with a detected increase in several prespecified safety outcomes over the parent trial and its open-label extension [18]. That is reassuring but limited by participant selection, observational comparisons, and the inability to exclude rare or lifelong effects. Unlimited lifelong safety at extremely low levels has not been, and cannot yet be, established.
What Guidelines Recommend
Guidelines turn many trials into practical goals. The 2026 U.S. multisociety dislipidemia guideline reintroduced explicit LDL-C goals and divides people with atherosclerotic enfermedad cardiovascular (ASCVD) into two groups [23]. Very-high-risk ASCVD means multiple major ASCVD events, or one major event plus multiple high-risk conditions; a recent heart attack alone does not automatically qualify.
| Who | What the 2026 U.S. guideline recommends |
| ASCVD, not very high risk | High-intensity statin; LDL-C below 70 mg/dL and non-HDL-C below 100 mg/dL (recommended) |
| ASCVD, not very high risk | Add ezetimibe, a PCSK9 antibody, or ácido bempedoico if needed to reach below 70 mg/dL |
| ASCVD, not very high risk | Going further, to below 55 mg/dL (non-HDL-C below 85) (reasonable) |
| Very-high-risk ASCVD | High-intensity statin; LDL-C below 55 mg/dL and non-HDL-C below 85 mg/dL (recommended) |
| Very-high-risk ASCVD | Add ezetimibe and/or a PCSK9 antibody if needed to reach those goals |
| Very-high-risk ASCVD | Bempedoic acid is a further add-on option |
“Recommended” and “reasonable” are shown only for the LDL-C and non-HDL-C goals, where they follow the guideline’s own wording for stronger and moderate recommendations. For add-on drugs, the guideline’s recommendation tables give the formal classes, evidence levels, and eligibility criteria, and separate recommendations apply in special situations such as hipercolesterolemia grave [23].
The 2025 U.S. acute coronary syndrome guideline recommends high-intensity statin therapy and timely addition of nonstatin therapy for those above recommended levels [51]. European guidance after a heart attack recommends at least a 50% reduction and LDL-C below 55 mg/dL [52], and allows a goal below 40 mg/dL after a second vascular event within two years [53]. None of these specific targets was directly tested against another in a randomized target trial; they are expert judgments built on the evidence above.
Should a Second Drug Start in the Hospital?
AMUNDSEN randomized 2,161 heart attack patients and demonstrated that a strategy of giving the first evolocumab injection before PCI substantially improved attainment of the combined LDL-C target at 12 months (82% versus 40%). However, the difference in the trial’s main clinical end point (tested second in the prespecified order, after the LDL-C target), death or unplanned cardiovascular hospitalization, was not statistically significant at one year (14.6% versus 15.4%; adjusted OR 0.94, 95% CI 0.73–1.19). The trial therefore supports faster, more reliable target attainment, but does not demonstrate an additional short-term clinical-event benefit from this initiation strategy [24]. Standard care permitted a PCSK9 inhibitor when indicated, but only 3.8% of the standard-care group received one. The trial was powered (80%) to detect an odds ratio of 0.68 for this end point, so it argues against a large early clinical effect of starting a PCSK9 inhibitor in the catheterization laboratory; it does not exclude a smaller benefit or one that emerges with longer treatment. A prespecified per-protocol analysis suggested fewer events with evolocumab (10.2% versus 14.3%), but the investigators caution that this is likely affected by selection bias. A one-year result does not refute the longer outcome trials. EVOLVE-MI, testing evolocumab within 10 days of a heart attack, had not reported by the search cutoff. For now, early combination therapy is comprobado to reach lower LDL-C sooner and, in PACMAN-AMI, to improve one-year plaque changes; it is not yet proven to prevent more events than adding the same drug weeks later.
Where ApoB Fits
The guideline gives ApoB a role in assessing riesgo residual. ApoB is most useful when it and LDL-C disagree, as in people with high triglycerides, diabetes, or obesity, where LDL-C can look “at goal” while particle number remains high. No randomized trial reviewed here has compared ApoB treatment targets with LDL-C targets, so ApoB is best used as an added measure of remaining carga de partículas rather than as a proven separate target.
En resumen
If someone has already had a heart attack, how much can intensive hipolipemiante change the disease and lower the chance of another event?
The disease: Within about a year, lowering LDL-C to roughly 25 to 30 mg/dL produces about twice the cap thickening seen with a statin alone, reduces imaging markers of lipid in untreated plaques, and adds roughly a 1.2 to 1.7 percentage-point reduction in percent atheroma volume compared with control groups. The plaque does not disappear, calcium does not dissolve, and the artery is not restored to normal.
The risk: In randomized trials after an acute coronary syndrome, relative reductions in each trial’s main composite endpoint were roughly 15%, with absolute benefits that differ by trial and follow-up. Across the pooled statin trials, each 38.7 mg/dL of LDL-C lowering reduced major vascular events by about 22%. Heart attacks and ischemic strokes are clearly reduced; a reduction in death is proven for statins in pooled analyses, but for add-on therapies only in nominal or open-label analyses.
How low can risk go: The studies reviewed have not identified a clear lower threshold, evidence becomes sparse at extreme LDL-C, and achieved-level analyses cannot define the optimal target; but events still occur even at extremely low LDL-C. People with lifelong low LDL-C have far less coronary disease, which points to duration of exposure as a major lever, but reductions in ischemic stroke and total mortality were not consistently shown. No evidence shows that cardiovascular events can be driven to zero.
| Well established | Sugestivo | Still unresolved |
| Lowering LDL-C after a heart attack reduces repeat heart attack, ischemic stroke, and procedures, in proportion to the LDL reduction | Benefit and safety at sustained LDL-C below 20 and even below 10 mg/dL | Whether starting a PCSK9 inhibitor in the hospital prevents more events than starting it weeks later |
| The benefit continues below 70 and 55 mg/dL in randomized comparisons | A lasting legacy benefit from earlier treatment (open-label, selected survivors) | Whether any target below 55 mg/dL beats another in a randomized trial |
| Intensive LDL lowering improves plaque composition and modestly reduces plaque volume over about a year | Far greater protection from lifelong low LDL-C | The true floor of risk with lifelong near-zero LDL-C |
| For statins, ezetimibe, and PCSK9 antibodies, benefits generally outweigh recognized harms in the populations studied | A cardiovascular-mortality benefit from adding PCSK9 inhibition | Lifelong safety at extremely low LDL-C |
| That plaque changes explain part of the benefit; that ApoB and Lp(a) modify the plaque response | How to prevent heart attacks caused by erosion; whether imaging-guided therapy helps |
Practical Points to Discuss With Your Cardiologist
- Start or continue high-intensity statin therapy during the hospital stay after an acute coronary syndrome, unless it is contraindicated or not tolerated.
- Know your numbers and your risk category. The 2026 U.S. guideline recommends an LDL-C goal below 55 mg/dL for people with ASCVD classified as very high risk and below 70 mg/dL for those who are not, with a goal below 55 mg/dL reasonable in selected patients who are not at very high risk; European ACS guidance generally recommends at least a 50% reduction and LDL-C below 55 mg/dL after an acute coronary syndrome. Ask your clinician which category you are in and what your goal is. If you are not at goal on a statin, ask about adding ezetimibe or a PCSK9 inhibitor.
- Ask for a one-time Lp(a) test, and consider ApoB, especially if your triglycerides are high or you have diabetes.
- Do not read a rising calcium score as failure on its own. Discuss what it means in your case.
- Treat the whole picture. Stop smoking, control blood pressure and glucosa en la sangre, attend rehabilitación cardíaca, and take prescribed terapia antiplaquetaria.
- Stay on therapy. LDL-C rises when treatment stops, and the benefit depends on how long it stays low.
Aviso médico: This article is for educational purposes and summarizes published research. It is not medical advice and does not replace individualized care from your physician. Do not start, stop, or change any medication without talking to your doctor.
Technical Appendix
About This Review
Esto revisión narrativa selectively summarizes landmark peer-reviewed studies available through October 2026 and is not a revisión sistemática or meta-analysis. Where full text was not available, I used the peer-reviewed abstract only when it contained enough detail to support the specific statement. Press releases, registry pages, and news coverage were not used as evidence. Numbers not supported by the sources consulted were excluded. Every value plotted in a data figure was checked against the published abstract or primary report, as listed in the companion figure register; supplementary tables were not used. The bibliographic details of all 54 references (authors, title, journal, year, volume, and pages) were checked against the Crossref registry.
A1. HUYGENS Results
| HUYGENS measure (change over about one year) | Evolocumab + estatina | Placebo + statin | Difference* | P value |
| Achieved LDL-C, mg/dL | 28.1 | 87.2 | about −59 | <0,001 |
| Minimum fibrous cap thickness, μm (primary endpoint) | +42.7 | +21.5 | +21.2 | 0.015 |
| Maximum lipid arc, degrees (secondary) | −57.5 | −31.4 | −26.1 | 0.04 |
| Macrophage index, mm (exploratory) | −3.17 | −1.45 | −1.72 | 0.04 |
| Percent atheroma volume, percentage points (IVUS subset; exploratory) | −2.29 | −0.61 | −1.68 | 0.009 |
| Microchannels and calcium (exploratory) | No hay diferencias significativas | NS |
*Values and P values are as reported in the published HUYGENS abstract; 135 treated patients had evaluable imaging at follow-up. The cap-thickness values are least-squares means from the trial’s analysis of covariance in the full analysis set of 161 treated patients, 119 with paired OCT (registry results: difference 21.2 μm, 95% CI 4.7–37.7); IVUS values come from a smaller subset. Other differences are simple arithmetic on the reported group means; the P values come from the trial’s own models. Source: [1].
The protocol prespecified the absolute change in minimum cap thickness as the primary endpoint; secondary endpoints were the percent change in minimum cap thickness, the change in average minimum cap thickness, and the change in maximum lipid arc; IVUS plaque burden, macrophages, and microchannels were exploratory. The trial planned about 150 patients so that 125 would complete paired imaging, with 90% power to detect a 51 μm benefit; the observed adjusted benefit, 21.2 μm, was less than half that assumption yet still statistically significant [9]. Imaging trials can only measure patients who survive, stay in the study, and undergo a second catheterization with usable images, so missing follow-up imaging can introduce selection bias.
A2. HUYGENS Subgroup Analyses
These small, post hoc findings are hypothesis-generating and do not establish separate treatment thresholds or independently causal mechanisms. They were based on subsets and not adjusted for multiple comparisons.
- Lipoproteína(a). In HUYGENS, the difference in cap thickening between evolocumab and placebo appeared larger in patients with high Lp(a) than in those with lower Lp(a), partly because the placebo-plus-statin group with high Lp(a) showed a smaller response [28]. Evolocumab lowered Lp(a) only modestly, and the analysis does not show that lowering Lp(a) caused the benefit. In PACMAN-AMI, baseline Lp(a) did not modify the plaque-volume or cap-thickness response to alirocumab, although patients with the highest Lp(a) had a smaller reduction in the plaque lipid signal [54].
- Patients who reached lower ApoB levels showed more favorable OCT findings than those who did not [29]. Achieved ApoB was not randomized, and the full adjustment model could not be examined, so this does not establish an optimal ApoB target or an independent causal effect.
- Achieved LDL-C. Pooling both arms, lower achieved LDL-C and larger LDL-C reductions were associated with greater cap thickening [1]; also non-randomized.
A3. Plaque-Imaging Trials
| Prueba | Población | Treatment vs comparator | Achieved LDL-C, mg/dL (mmol/L) | Imaging, duration | Main plaque finding | Key limitations |
| HUYGENS (2022) [1] | 161 post-NSTEMI | Evolocumab vs placebo, both + statin | 28.1 vs 87.2 (0.73 vs 2.25) | OCT; IVUS subset; 50 wk | Cap +42.7 vs +21.5 μm; lipid arc −57.5° vs −31.4°; PAV −2.29 vs −0.61 | 135 with evaluable follow-up imaging; denominators vary by endpoint; selected plaque |
| PACMAN-AMI (2022) [7] | 300 acute MI, started <24 h after PCI | Alirocumab vs placebo, both + rosuvastatin 20 | 23.6 vs 74.4 (0.61 vs 1.92) | IVUS + NIRS + OCT; 52 wk | PAV diff −1.21; LCBI diff −41.24; cap diff +29.65 μm | 265 paired IVUS; 81% men |
| GLAGOV (2016) [30] | 968 stable CAD on statin | Evolocumab vs placebo | 36.6 vs 93.0 (0.95 vs 2.41) | IVUS; 76 wk treatment, week-78 IVUS | PAV −0.95 vs +0.05; regression 64% vs 47% | Not post-MI; composition substudy neutral |
| REVERSAL (2004) [32] | 654 stable CAD | Atorvastatin 80 vs pravastatina 40 | 79 vs 110 (2.0 vs 2.8) | IVUS; 18 mo | Progression halted vs continued | Moderate LDL levels |
| ASTEROID (2006) [33] | 507 CAD | Rosuvastatin 40, single arm | 60.8 (1.57) | IVUS; 24 mo | PAV −0.98 | No control; attrition |
| SATURN (2011) [34] | 1,385 CAD randomized; 1,039 with follow-up IVUS | Rosuvastatin 40 vs atorvastatin 80 | 62.6 vs 70.2 (1.62 vs 1.82) | IVUS; 104 wk | Median PAV −1.22 vs −0.99 (P=0.17) | No significant difference between the two statins; both regressed; no placebo arm |
| PRECISE-IVUS (2015) [35] | 246 after PCI, Japan | Atorvastatin + ezetimibe vs atorvastatin | 63.2 vs 73.3 (1.63 vs 1.90) | IVUS; 9–12 mo | PAV −1.4 vs −0.3; regression 78% vs 58% | Open label |
| EASY-FIT (2014) [36] | 70 unstable angina | Atorvastatin 20 vs 5 | 69 vs 78 (1.78 vs 2.02) | OCT; 12 mo | Cap +69% vs +17% | Small; low-dose comparator |
| ODYSSEY J-IVUS (2019) [39] | 206 recent ACS, Japan | Alirocumab vs standard care | Not shown | IVUS; 36 wk | No significant difference in primary plaque endpoint | Neutral; short duration |
| YELLOW III (2026) [37] | 110 stable CAD, lipid-rich plaque | Evolocumab + statin, single arm | Not reported in sources reviewed | OCT + NIRS-IVUS; 26 wk | Cap 70.9 → 97.7 μm; maxLCBI4mm 306.8 → 213.1; PAV −1.38 points | No control group |
| CCTA/PET study (2025) [38] | 47 stable, noncalcified plaque | Evolocumab, single arm | Not reported in sources reviewed | CCTA + PET; 18 mo | Noncalcified plaque fell; calcified plaque rose | No control group |
Values are not directly comparable across trials. PACMAN-AMI “diff” values are model-based between-group differences; other entries are within-arm changes as reported. PAV, percent atheroma volume; TAV, total atheroma volume; LCBI, núcleo lipídico burden index.
A4. Major Outcome Trials in Detail
| Prueba | Population, timing, follow-up | Treatment vs comparator | LDL-C, mg/dL (baseline; achieved) | Primary endpoint | Resultado | Mortality |
| MIRACL (2001) [43] | 3,086 unstable angina or non-Q-wave MI; 24–96 h; 16 wk | Atorvastatin 80 vs placebo | ~124; 72 vs 135 at 16 wk | Death, MI, resuscitated arrest, or recurrent isquemia with rehospitalization | 14.8% vs 17.4%; RR 0.84 (0.70–1.00) | No significant reduction in death or MI; benefit driven mainly by fewer rehospitalizations for symptomatic ischemia |
| PROVE IT–TIMI 22 (2004) [10] | 4,162 ACS; within 10 days; mean 24 mo | Atorvastatin 80 vs pravastatin 40 | 106; 62 vs 95 | Death, MI, UA rehospitalization, revascularization, or stroke | 22.4% vs 26.3%; 16% reduction (5%–26%) | Death 2.2% vs 3.2%; P=0.07 |
| IMPROVE-IT (2015) [4] | 18,144 ACS; within 10 days; median ~6 y | Simvastatin + ezetimibe vs simvastatin | 93.8; 53.7 vs 69.5 | CV death, major coronary event, or nonfatal stroke | 32.7% vs 34.7% at 7 y; HR 0.936 (0.89–0.99) | No difference |
| ODYSSEY OUTCOMES (2018) [3] | 18,924 ACS 1–12 mo earlier; median 2.8 y | Alirocumab vs placebo + statin | ~92 (mean); ~40 vs ~93 at 4 mo | CHD death, MI, ischemic stroke, or UA hospitalization | 9.5% vs 11.1%; HR 0.85 (0.78–0.93) | All-cause death 3.5% vs 4.1%, nominal only |
| FOURIER (2017) [2] | 27,564 stable ASCVD; median 2.2 y | Evolocumab vs placebo + statin | 92 (median); 30 with evolocumab at 48 wk, 56 mg/dL lower than placebo | CV death, MI, stroke, UA hospitalization, or revascularization | 9.8% vs 11.3%; HR 0.85 (0.79–0.92) | CV death HR 1.05 (0.88–1.25) |
| FOURIER-OLE (2022) [14] | 6,635 FOURIER completers; median 5 more years | Original evolocumab vs original placebo, all on open-label drug | Median ~30 at extension week 12, on open-label evolocumab | Same as FOURIER | 3.36 vs 3.96 per 100 person-years; HR 0.85 (0.75–0.96) | CV death 0.68 vs 0.90 per 100 person-years, HR 0.77 (0.60–0.99); exploratory |
| AMUNDSEN (2026) [24] | 2,161 STEMI/NSTEMI (1,087 vs 1,074); open label; 12 mo | Evolocumab before PCI + standard care vs standard care (PCSK9 inhibitor permitted; used in 3.8%) | Median 16 vs 56 at 6 wk | LDL-C <55 and ≥50% reduction; main clinical end point tested second in a prespecified hierarchy (80% power for OR 0.68) | 792/970 (82%) vs 370/934 (40%); aOR 5.54 (4.50–6.82). Clinical composite 159/1,087 (14.6%) vs 165/1,074 (15.4%); aOR 0.94 (0.73–1.19) | Not significant |
Event rates are Kaplan–Meier estimates for PROVE IT–TIMI 22 and IMPROVE-IT and observed proportions for the others. Endpoints, populations, and follow-up differ, so these figures should not be compared across trials. AMUNDSEN was checked against the full primary JAMA article. CV, cardiovascular; CHD, coronary heart disease; UA, unstable angina.
| Endpoint (treatment vs control) | IMPROVE-IT (7 y) [4] | ODYSSEY OUTCOMES (median 2.8 y) [3] | FOURIER (median 2.2 y) [2] |
| Infarto de miocardio | 13.1% vs 14.8% | 6.6% vs 7.6% | 3.4% vs 4.6% (HR 0.73) |
| Stroke (trial-specific definition) | Ischemic stroke 3.4% vs 4.1% | Ischemic stroke 1.2% vs 1.6% | Any stroke 1.5% vs 1.9% (HR 0.79) |
| Coronary revascularization | 21.8% vs 23.4% (not significant) | Ischemia-driven, lower with alirocumab | 5.5% vs 7.0% (HR 0.78) |
| Cardiovascular death | No hay diferencias significativas | Not significant (HR 0.88) | No difference (HR 1.05) |
| Mortalidad por todas las causas | No hay diferencias significativas | 3.5% vs 4.1% (HR 0.85), nominal only | No difference |
These components are secondary or nominal analyses, not multiplicity-controlled results.
A5. Limitations of the Evidence
- Small imaging trials. HUYGENS randomized 161 patients, 135 of whom had evaluable follow-up imaging; PACMAN-AMI randomized 300, with 265 having paired IVUS. Both selected particular segments, had missing follow-up imaging, and enrolled mostly men. HUYGENS selected patients with already vulnerable-looking plaque.
- Imaging is not histology. OCT can mistake fibrous tissue for lipid, and macrophage signals are indirect.
- Financiamiento de la industria. Amgen funded HUYGENS, GLAGOV, and FOURIER; Sanofi and Regeneron supported ODYSSEY OUTCOMES, and Sanofi, Regeneron, and Infraredx funded PACMAN-AMI; Merck funded IMPROVE-IT; AstraZeneca funded SATURN. The major outcome trials used blinded treatment and independent event adjudicación, which limits but does not eliminate the concern.
- Different populations. The outcome trials differ in timing, background therapy, and endpoint definitions.
- Achieved-LDL and open-label analyses are vulnerable to selection and confounding.
- Genetic studies estimate lifelong effects of specific variants; their effect sizes cannot be transferred directly to drugs started in adulthood.
- Abstract-level sources. The following were reviewed at the abstract or published-summary level rather than in full text: the HUYGENS primary report (supplemented by its registry results) and ApoB analysis, Cohen 2006 (PCSK9 variants), Peloso 2019 (APOB variants), Benn 2010 and Benn 2019 (PCSK9 R46L), and Ference 2012 (Mendelian aleatorización). These are also marked in the reference list.
- Sources of figure data. Each data figure plots values reported in the study cited in its caption; conceptual and model figures are labeled as illustrative.
- Review method. This narrative review is based on selected peer-reviewed studies and guidelines rather than a registered systematic search. Some findings were extracted from peer-reviewed abstracts or published summaries. Numbers not supported by the sources consulted were excluded. Figure values were checked against the published abstracts or primary reports listed in the companion figure register, and each statement in the text is supported by its cited source at the level indicated above (abstract or full text).
Referencias
- Nicholls SJ, Kataoka Y, Nissen SE, et al. Effect of evolocumab on coronary plaque phenotype and burden in statin-treated patients following myocardial infarction (HUYGENS). JACC Cardiovasc Imaging. 2022;15(7):1308-1321. doi:10.1016/j.jcmg.2022.03.002. PubMed: https://pubmed.ncbi.nlm.nih.gov/35431172/
- Sabatine MS, Giugliano RP, Keech AC, et al. Evolocumab and clinical outcomes in patients with cardiovascular disease (FOURIER). N Engl J Med. 2017;376:1713-1722. doi:10.1056/NEJMoa1615664. PubMed: https://pubmed.ncbi.nlm.nih.gov/28304224/
- Schwartz GG, Steg PG, Szarek M, et al. Alirocumab and cardiovascular outcomes after acute coronary syndrome (ODYSSEY OUTCOMES). N Engl J Med. 2018;379:2097-2107. doi:10.1056/NEJMoa1801174. PubMed: https://pubmed.ncbi.nlm.nih.gov/30403574/
- Cannon CP, Blazing MA, Giugliano RP, et al. Ezetimibe added to statin therapy after acute coronary syndromes (IMPROVE-IT). N Engl J Med. 2015;372:2387-2397. doi:10.1056/NEJMoa1410489. PubMed: https://pubmed.ncbi.nlm.nih.gov/26039521/
- Cohen JC, Boerwinkle E, Mosley TH Jr, Hobbs HH. Sequence variations in PCSK9, low LDL, and protection against coronary heart disease. N Engl J Med. 2006;354:1264-1272. doi:10.1056/NEJMoa054013 [abstract reviewed]
- Ference BA, Yoo W, Alesh I, et al. Effect of long-term exposure to lower low-density lipoprotein cholesterol beginning early in life on the risk of coronary heart disease: a Mendelian randomization analysis. J Am Coll Cardiol. 2012;60:2631-2639. doi:10.1016/j.jacc.2012.09.017 [abstract summary reviewed]
- Räber L, Ueki Y, Otsuka T, et al. Effect of alirocumab added to high-intensity statin therapy on coronary atherosclerosis in patients with acute myocardial infarction: the PACMAN-AMI randomized clinical trial. JAMA. 2022;327:1771-1781. doi:10.1001/jama.2022.5218
- Stone GW, Maehara A, Lansky AJ, et al. A prospective natural-history study of coronary atherosclerosis (PROSPECT). N Engl J Med. 2011;364:226-235. doi:10.1056/NEJMoa1002358
- Nicholls SJ, Nissen SE, Prati F, et al. Assessing the impact of PCSK9 inhibition on coronary plaque phenotype with optical coherence tomography: rationale and design of the randomized, placebo-controlled HUYGENS study. Cardiovasc Diagn Ther. 2021;11(1):120-129. doi:10.21037/cdt-20-684. PMCID: PMC7944215. PubMed: https://pubmed.ncbi.nlm.nih.gov/33708484/
- Cannon CP, Braunwald E, McCabe CH, et al. Intensive versus moderate lipid lowering with statins after acute coronary syndromes (PROVE IT–TIMI 22). N Engl J Med. 2004;350:1495-1504. doi:10.1056/NEJMoa040583. PubMed: https://pubmed.ncbi.nlm.nih.gov/15007110/
- Murphy SA, Pedersen TR, Gaciong ZA, et al. Effect of the PCSK9 inhibitor evolocumab on total cardiovascular events in patients with cardiovascular disease: a prespecified analysis from the FOURIER trial. JAMA Cardiol. 2019;4:613-619. doi:10.1001/jamacardio.2019.0886
- Cholesterol Treatment Trialists’ (CTT) Collaboration. Efficacy and safety of more intensive lowering of LDL cholesterol: a meta-analysis of data from 170,000 participants in 26 randomised trials. Lancet. 2010;376:1670-1681. doi:10.1016/S0140-6736(10)61350-5. PubMed: https://pubmed.ncbi.nlm.nih.gov/21067804/
- Silverman MG, Ference BA, Im K, et al. Association between lowering LDL-C and cardiovascular risk reduction among different therapeutic interventions: a systematic review and meta-analysis. JAMA. 2016;316:1289-1297. doi:10.1001/jama.2016.13985
- O’Donoghue ML, Giugliano RP, Wiviott SD, et al. Long-term evolocumab in patients with established atherosclerotic cardiovascular disease (FOURIER-OLE). Circulation. 2022;146:1109-1119. doi:10.1161/CIRCULATIONAHA.122.061620
- Hopewell JC, Malik R, Valdés-Márquez E, Worrall BB, Collins R; METASTROKE Collaboration of the ISGC. Differential effects of PCSK9 variants on risk of coronary disease and ischaemic stroke. Eur Heart J. 2018;39:354-359. doi:10.1093/eurheartj/ehx373
- Benn M, Tybjærg-Hansen A, Nordestgaard BG. Low LDL cholesterol by PCSK9 variation reduces cardiovascular mortality. J Am Coll Cardiol. 2019;73:3102-3114. doi:10.1016/j.jacc.2019.03.517 [abstract reviewed]
- Giugliano RP, Pedersen TR, Park JG, et al. Clinical efficacy and safety of achieving very low LDL-cholesterol concentrations with the PCSK9 inhibitor evolocumab: a prespecified secondary analysis of the FOURIER trial. Lancet. 2017;390:1962-1971. doi:10.1016/S0140-6736(17)32290-0
- Gaba P, O’Donoghue ML, Park JG, et al. Association between achieved low-density lipoprotein cholesterol levels and long-term cardiovascular and safety outcomes: an analysis of FOURIER-OLE. Circulation. 2023;147:1192-1203. doi:10.1161/CIRCULATIONAHA.122.063399
- Ridker PM, Everett BM, Thuren T, et al. Antiinflammatory therapy with canakinumab for atherosclerotic disease (CANTOS). N Engl J Med. 2017;377:1119-1131. doi:10.1056/NEJMoa1707914
- Tardif JC, Kouz S, Waters DD, et al. Efficacy and safety of low-dose colchicine after myocardial infarction (COLCOT). N Engl J Med. 2019;381:2497-2505. doi:10.1056/NEJMoa1912388
- Giugliano RP, Mach F, Zavitz K, et al. Cognitive function in a randomized trial of evolocumab (EBBINGHAUS). N Engl J Med. 2017;377:633-643. doi:10.1056/NEJMoa1701131. PubMed: https://pubmed.ncbi.nlm.nih.gov/28813214/
- Sattar N, Preiss D, Murray HM, et al. Statins and risk of incident diabetes: a collaborative meta-analysis of randomised statin trials. Lancet. 2010;375:735-742. doi:10.1016/S0140-6736(09)61965-6
- Blumenthal RS, et al. 2026 ACC/AHA/AACVPR/ABC/ACPM/ADA/AGS/APhA/ASPC/NLA/PCNA guideline on the management of dyslipidemia. Circulation. 2026;153(17). doi:10.1161/CIR.0000000000001423. Copublished in J Am Coll Cardiol. 2026;87(19):2624-2757. doi:10.1016/j.jacc.2025.11.016. PubMed: https://pubmed.ncbi.nlm.nih.gov/41824552/
- Montalescot G, Ferrari E, Souteyrand G, et al. LDL cholesterol lowering with evolocumab before percutaneous coronary intervention for acute myocardial infarction: the AMUNDSEN randomized clinical trial. JAMA. Published online August 29, 2026. doi:10.1001/jama.2026.17302. PubMed: https://pubmed.ncbi.nlm.nih.gov/42666092/
- Burke AP, Farb A, Malcom GT, et al. Coronary risk factors and plaque morphology in men with coronary disease who died suddenly. N Engl J Med. 1997;336:1276-1282. doi:10.1056/NEJM199705013361802
- Jia H, Abtahian F, Aguirre AD, et al. In vivo diagnosis of plaque erosion and calcified nodule in patients with acute coronary syndrome by intravascular optical coherence tomography. J Am Coll Cardiol. 2013;62:1748-1758. doi:10.1016/j.jacc.2013.05.071
- Fujino M, Nicholls SJ. PCSK9 inhibitors and coronary atherosclerosis: insights from recent intravascular imaging clinical trials. Cardiometab Syndr J. 2023;3(2):103-109. doi:10.51789/cmsj.2023.3.e14
- Di Giovanni G, et al. Impact of evolocumab on plaque phenotypic changes in patients with acute coronary syndrome and elevated lipoprotein(a) levels: a HUYGENS secondary analysis. Eur J Prev Cardiol. 2026;33(11):2047-2054. doi:10.1093/eurjpc/zwaf211
- Fujino M, et al. Achieved levels of apolipoprotein B and plaque composition after acute coronary syndromes: insights from HUYGENS. Atherosclerosis. 2025;403:119145. doi:10.1016/j.atherosclerosis.2025.119145 [abstract reviewed]
- Nicholls SJ, Puri R, Anderson T, et al. Effect of evolocumab on progression of coronary disease in statin-treated patients: the GLAGOV randomized clinical trial. JAMA. 2016;316:2373-2384. doi:10.1001/jama.2016.16951. PubMed: https://pubmed.ncbi.nlm.nih.gov/27846344/
- Nicholls SJ, et al. Effect of evolocumab on coronary plaque composition. J Am Coll Cardiol. 2018;72:2012-2021. doi:10.1016/j.jacc.2018.06.078
- Nissen SE, Tuzcu EM, Schoenhagen P, et al. Effect of intensive compared with moderate lipid-lowering therapy on progression of coronary atherosclerosis: a randomized controlled trial (REVERSAL). JAMA. 2004;291:1071-1080. doi:10.1001/jama.291.9.1071
- Nissen SE, Nicholls SJ, Sipahi I, et al. Effect of very high-intensity statin therapy on regression of coronary atherosclerosis: the ASTEROID trial. JAMA. 2006;295:1556-1565. doi:10.1001/jama.295.13.jpc60002
- Nicholls SJ, Ballantyne CM, Barter PJ, et al. Effect of two intensive statin regimens on progression of coronary disease (SATURN). N Engl J Med. 2011;365:2078-2087. doi:10.1056/NEJMoa1110874. PubMed: https://pubmed.ncbi.nlm.nih.gov/22085316/
- Tsujita K, Sugiyama S, Sumida H, et al. Impact of dual lipid-lowering strategy with ezetimibe and atorvastatin on coronary plaque regression in patients with percutaneous coronary intervention: the multicenter randomized controlled PRECISE-IVUS trial. J Am Coll Cardiol. 2015;66:495-507. doi:10.1016/j.jacc.2015.05.065. PubMed: https://pubmed.ncbi.nlm.nih.gov/26227186/
- Komukai K, Kubo T, Kitabata H, et al. Effect of atorvastatin therapy on fibrous cap thickness in coronary atherosclerotic plaque as assessed by optical coherence tomography: the EASY-FIT study. J Am Coll Cardiol. 2014;64:2207-2217. doi:10.1016/j.jacc.2014.08.045
- Kini AS, Vengrenyuk Y, Liu J, et al. Intracoronary imaging and transcriptomic characteristics before and after maximum lipid-lowering therapy: YELLOW-III study of evolocumab and maximum statin therapy in chronic coronary disease. JACC Cardiovasc Imaging. 2026;19(4):516-534. doi:10.1016/j.jcmg.2025.12.013. PubMed: https://pubmed.ncbi.nlm.nih.gov/41758107/
- Han D, et al. Effects of evolocumab on coronary plaque composition and microcalcification activity by coronary PET and CT angiography. JACC Cardiovasc Imaging. 2025;18:589-599. doi:10.1016/j.jcmg.2025.01.005. PubMed: https://pubmed.ncbi.nlm.nih.gov/40178463/
- Ako J, Hibi K, Tsujita K, et al. Effect of alirocumab on coronary atheroma volume in Japanese patients with acute coronary syndrome: the ODYSSEY J-IVUS trial. Circ J. 2019;83(10):2025-2033. doi:10.1253/circj.CJ-19-0412
- Prati F, Romagnoli E, Gatto L, et al. Relationship between coronary plaque morphology of the left anterior descending artery and 12 months clinical outcome: the CLIMA study. Eur Heart J. 2020;41:383-391. doi:10.1093/eurheartj/ehz520
- Puri R, Nicholls SJ, Shao M, et al. Impact of statins on serial coronary calcification during atheroma progression and regression. J Am Coll Cardiol. 2015;65:1273-1282. doi:10.1016/j.jacc.2015.01.036
- Lee SE, Chang HJ, Sung JM, et al. Effects of statins on coronary atherosclerotic plaques: the PARADIGM study. JACC Cardiovasc Imaging. 2018;11:1475-1484. doi:10.1016/j.jcmg.2018.04.015
- Schwartz GG, Olsson AG, Ezekowitz MD, et al. Effects of atorvastatin on early recurrent ischemic events in acute coronary syndromes: the MIRACL study. JAMA. 2001;285:1711-1718. doi:10.1001/jama.285.13.1711. PubMed: https://pubmed.ncbi.nlm.nih.gov/11277825/
- Ference BA, Ginsberg HN, Graham I, et al. Low-density lipoproteins cause atherosclerotic cardiovascular disease. 1. Evidence from genetic, epidemiologic, and clinical studies. A consensus statement from the European Atherosclerosis Society Consensus Panel. Eur Heart J. 2017;38:2459-2472. doi:10.1093/eurheartj/ehx144
- Schwartz GG, Szarek M, Bittner VA, et al. Transiently achieved very low LDL-cholesterol levels by statin and alirocumab after acute coronary syndrome are associated with cardiovascular risk reduction: the ODYSSEY OUTCOMES trial. Eur Heart J. 2023;44:1408-1417. doi:10.1093/eurheartj/ehad144. PubMed: https://pubmed.ncbi.nlm.nih.gov/36879424/
- Nidorf SM, Fiolet ATL, Mosterd A, et al. Colchicine in patients with chronic coronary disease (LoDoCo2). N Engl J Med. 2020;383:1838-1847. doi:10.1056/NEJMoa2021372
- Peloso GM, Nomura A, Khera AV, et al. Rare protein-truncating variants in APOB, lower low-density lipoprotein cholesterol, and protection against coronary heart disease. Circ Genom Precis Med. 2019;12:e002376. doi:10.1161/CIRCGEN.118.002376 [abstract reviewed]
- Benn M, Nordestgaard BG, Grande P, Schnohr P, Tybjaerg-Hansen A. PCSK9 R46L, low-density lipoprotein cholesterol levels, and risk of ischemic heart disease: 3 independent studies and meta-analyses. J Am Coll Cardiol. 2010;55:2833-2842. doi:10.1016/j.jacc.2010.02.044 [abstract reviewed]
- Zhao Z, Tuakli-Wosornu Y, Lagace TA, et al. Molecular characterization of loss-of-function mutations in PCSK9 and identification of a compound heterozygote. Am J Hum Genet. 2006;79(3):514-523. doi:10.1086/507488. PMCID: PMC1559532
- Amarenco P, Bogousslavsky J, Callahan A 3rd, et al. High-dose atorvastatin after stroke or transient ischemic attack (SPARCL). N Engl J Med. 2006;355:549-559. doi:10.1056/NEJMoa061894
- Rao SV, O’Donoghue ML, Ruel M, et al. 2025 ACC/AHA/ACEP/NAEMSP/SCAI guideline for the management of patients with acute coronary syndromes. J Am Coll Cardiol. 2025;85:2135-2237. doi:10.1016/j.jacc.2024.11.009. PubMed: https://pubmed.ncbi.nlm.nih.gov/40013746/
- Byrne RA, Rossello X, Coughlan JJ, et al. 2023 ESC guidelines for the management of acute coronary syndromes. Eur Heart J Acute Cardiovasc Care. 2024;13:55-161. doi:10.1093/ehjacc/zuad107. PubMed: https://pubmed.ncbi.nlm.nih.gov/37740496/
- Mach F, Baigent C, Catapano AL, et al. 2019 ESC/EAS guidelines for the management of dyslipidaemias: lipid modification to reduce cardiovascular risk. Atherosclerosis. 2019;290:140-205. doi:10.1016/j.atherosclerosis.2019.08.014. PubMed: https://pubmed.ncbi.nlm.nih.gov/31591002/
- Koskinas KC, Häner J, Ueki Y, et al. Association of lipoprotein(a) with changes in coronary atherosclerosis in patients treated with alirocumab. Circ Cardiovasc Imaging. 2024;17:e016683. doi:10.1161/CIRCIMAGING.124.016683. PubMed: https://pubmed.ncbi.nlm.nih.gov/39561225/